

A random sample of 80 observations of the continuous random variable X was taken and the values
Question:
A random sample of 80 observations of the continuous random variable X was taken and the values are summarised in the following table.

It is required to test the goodness of fit of the distribution having probability density function f given by
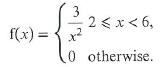
a. Show that the expected frequency for the interval 2 ≤ x < 3 is 40 and calculate the remaining expected frequencies.
b. Carry out a goodness of fit test, at the 10% significance level.
Fantastic news! We've Found the answer you've been seeking!
Step by Step Answer:
a To calculate the expected frequency for the interval 2 x 3 we integrate the probability density fu...View the full answer

Answered By
Abdul Wahab Qaiser
Before working at Mariakani, I volunteered at a local community center, where I tutored students from diverse backgrounds. I helped them improve their academic performance and develop self-esteem and confidence. I used creative teaching methods, such as role-playing and group discussions, to make the learning experience more engaging and enjoyable.
In addition, I have conducted workshops and training sessions for educators and mental health professionals on various topics related to counseling and psychology. I have presented research papers at conferences and published articles in academic journals.
Overall, I am passionate about sharing my knowledge and helping others achieve their goals. I believe that tutoring is an excellent way to make a positive impact on people's lives, and I am committed to providing high-quality, personalized instruction to my students.
0 Reviews
10+ Question Solved
Related Book For 

Cambridge International AS & A Level Further Mathematics Coursebook
ISBN: 9781108403375
1st Edition
Authors: Lee Mckelvey, Martin Crozier
Question Posted:
