

Question: Why does an experimental sieve analysis tend to size platelets (Figure 15-7D) based on the second-largest dimension? Assume that holes in the sieve are square.
Why does an experimental sieve analysis tend to size platelets (Figure 15-7D) based on the second-largest dimension? Assume that holes in the sieve are square.
Figure 15-7D
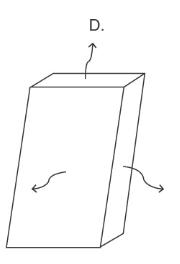
D.
Step by Step Solution
There are 3 Steps involved in it
1 Expert Approved Answer
Step: 1 Unlock

Question Has Been Solved by an Expert!
Get step-by-step solutions from verified subject matter experts
Step: 2 Unlock
Step: 3 Unlock