

Question: Phase diagrams are very useful for predicting the changes that substances will undergo when the conditions are changed and are widely used in geology and
Phase diagrams are very useful for predicting the changes that substances will undergo when the conditions are changed and are widely used in geology and metallurgy. Even a phase diagram of a simple, familiar substance can be revealing. Use the phase diagram in Fig. 5B.2 to describe the physical states and phase changes of water as the pressure on it is increased from 5 Torr to 800 Torr at 70°C.
ANTICIPATE Because the pressure is increasing, you should expect the vapor to condense.
PLAN First, locate the initial and final conditions on the phase diagram. The region in which each of these points lies shows the stable phase of the sample under those conditions. If a point lies on one of the curves, then both phases are present in equilibrium.
FIGURE 5B.2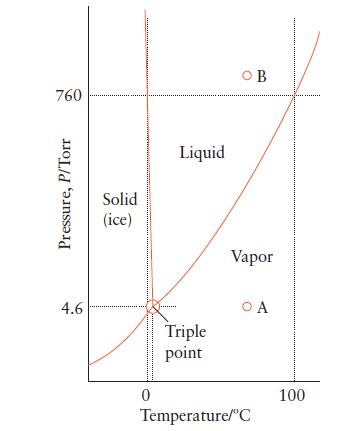
760 Pressure, P/Torr 4.6 Solid (ice) ********* 0 Liquid Triple point OB Vapor OA Temperature/C 100
Step by Step Solution
3.47 Rating (157 Votes )
There are 3 Steps involved in it
FIGURE 5B2 From the phase diagram of water in Fig 5B2 Although the phase diagram in Fig 5B2 is not t... View full answer

Get step-by-step solutions from verified subject matter experts