

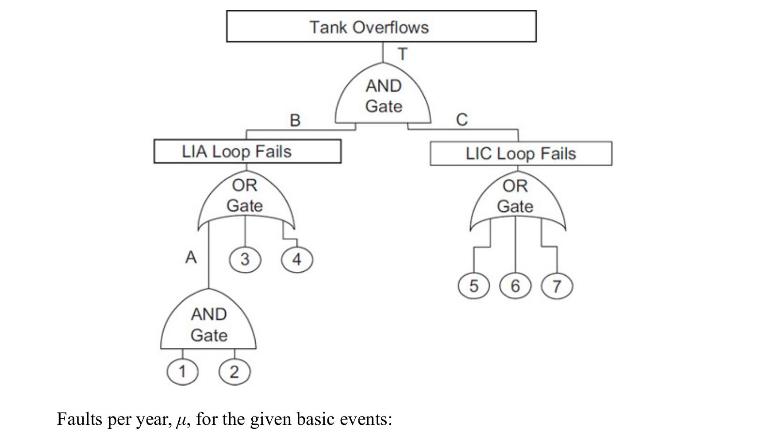
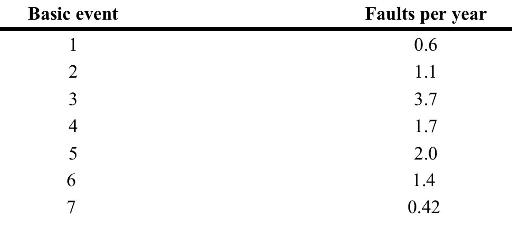
For the figure and failure rates shown below, determine for the top event the probability of failure,
Question:
For the figure and failure rates shown below, determine for the top event the probability of failure, the reliability, and the MTBF.
Fantastic news! We've Found the answer you've been seeking!
Step by Step Answer:
To solve this we will follow a stepbystep approach Lets begin by understanding the fault tree and the given fault rates Fault tree analysis FTA is a topdown deductive failure analysis in which an unde...View the full answer

Answered By
ANDREW KIPRUTO
Academic Writing Expert
I have over 7 years of research and application experience. I am trained and licensed to provide expertise in IT information, computer sciences related topics and other units like chemistry, Business, law, biology, biochemistry, and genetics. I'm a network and IT admin with +8 years of experience in all kind of environments.
I can help you in the following areas:
Networking
- Ethernet, Wireless Airmax and 802.11, fiber networks on GPON/GEPON and WDM
- Protocols and IP Services: VLANs, LACP, ACLs, VPNs, OSPF, BGP, RADIUS, PPPoE, DNS, Proxies, SNMP
- Vendors: MikroTik, Ubiquiti, Cisco, Juniper, HP, Dell, DrayTek, SMC, Zyxel, Furukawa Electric, and many more
- Monitoring Systems: PRTG, Zabbix, Whatsup Gold, TheDude, RRDtoo
Always available for new projects! Contact me for any inquiries
1+ Reviews
10+ Question Solved
Related Book For 

Chemical Process Safety Fundamentals With Applications
ISBN: 9780134857770
4th Edition
Authors: Daniel A. Crowl, Joseph F. Louvar
Question Posted:
