

An EadieHofstee Plot is shown in Figure P9-14B for different types of enzyme inhibition. Figure P9-14B a.
Question:
An Eadie–Hofstee Plot is shown in Figure P9-14B for different types of enzyme inhibition.
Figure P9-14B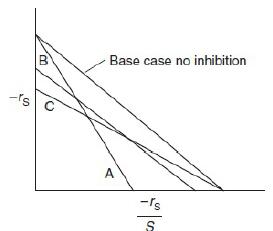 a. Match the line with the type of inhibition.
1. Line A Inhibition Mechanism. Ans: ________
2. Line B Inhibition Mechanism. Ans: ________
3. Line C Inhibition Mechanism. Ans: ________
An Eadie-Hofstee plot is shown. The vertical axis represents the reaction rate and the horizontal axis represents the ratio between reaction rate and concentration of substrate. 4 lines are plotted, out of which one represents the base case where no inhibition occurs and lines A, B, and C where inhibition mechanism occurs. The base case shows maximum values and shows a slower decreasing trend. The curves for A, B, and C also show a decreasing trend, where A shows the maximum decreasing trend. The y-intercept for the base case and A are the same, and the x-intercept for B is closer to that of the base case. The x-intercept of the base case is the same as that of C.
b. Draw a Hanes–Woolf plot analogous to Figure P9-14B for the three types of inhibition and the case of no inhibition.
Step by Step Answer:
a We know that in an Eadie Hofstee Plot Competitive inhibition slope changes intercept rem...View the full answer


