

Computer Experiments on a PFR for Reaction in Table 12-2.2. In order to develop a greater understanding
Question:
Computer Experiments on a PFR for Reaction in Table 12-2.2. In order to develop a greater understanding of the temperature
effects in PBRs, download the Living Example Problem Table 12-2, LEP T12-2, from the Web site to learn how changing the different parameters changes the conversion and temperature profiles. This is a Sherlock Holmes Problem. Starting with the base case, one, and only one, parameter was varied between its maximum and minimum values to give the following figures. You need to decide what operating variable (e.g., T0) property value (e.g., CPA), or engineering variable (e.g., Uaρb) was varied. Choose from the following:
k1,E, R, CT0,Ta,T0,T1,T2,KC2,ΘB,Θ1,ΔHRx∘,CPA,CPB,CPC,Ua,ρa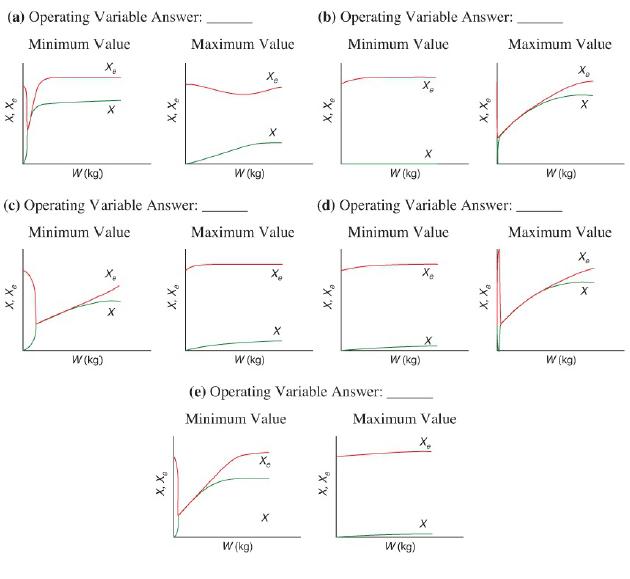
10 Graphs are shown, each displaying minimum or maximum values and two curves are plotted for X and X subscript e. The horizontal axis of each graph represents the weight W in kilogram and the vertical axis of each graph represents X and X Subscript e. It is observed that X subscript e shows a higher value that X for almost all the cases. 5 graphs show intersecting points of X and X subscript e. In 4 graphs, X subscript e shows a nearly constant trend, while x is closer to the horizontal axis (low value).
Step by Step Answer:
a F A...View the full answer


