

The graphs labeled (a) and (b) show the titration curves for two equal-volume samples of monoprotic acids,
Question:
The graphs labeled (a) and (b) show the titration curves for two equal-volume samples of monoprotic acids, one weak and one strong. Both titrations were carried out with the same concentration of strong base.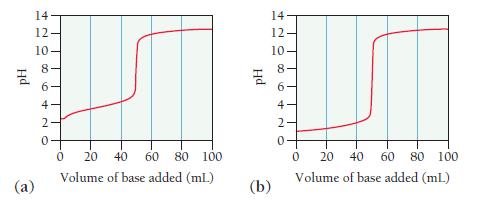
i. What is the approximate pH at the equivalence point of each curve?
ii. Which graph corresponds to the titration of the strong acid and which one to the titration of the weak acid?
Fantastic news! We've Found the answer you've been seeking!
Step by Step Answer:
i a pH 8 ...View the full answer

Answered By
ADITYA NAIR H
I LOVE MATHEMATICS AND ENJOY ENTHUSIASTIC PEOPLE INTERESTED IN IT.
I WASN'T ALWAYS THE BEST IN MATHEMATICS BUT EVENTUALLY PRACTICE MADE ME PERFECT. I HAVE BEEN THERE SO I CAN UNDERSTAND AND HELP YOU OUT WITH MATHEMATICS AND ENGINEERING CONCEPTS. I AM PRETTY MUCH COMFORTABLE IN EXPLAINING THEM ALSO.
0 Reviews
10+ Question Solved
Related Book For 

Question Posted:
