

Question: The graphs below labeled (a) and (b) show the titration curves for two equal-volume samples of monoprotic acids, one weak and one strong. Both titrations
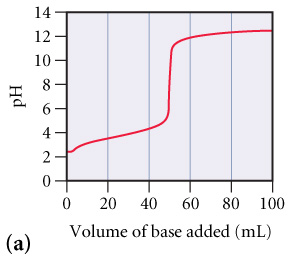
The graphs below labeled (a) and (b) show the titration curves for two equal-volume samples of monoprotic acids, one weak and one strong. Both titrations were carried out with the same concentration of strong base.
What is the approximate pH at the equivalence point of (a) curve? (Figure 1)
Express your answer as a whole numbe
c
Part B
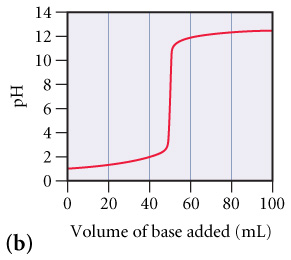
What is the approximate pH at the equivalence point of (b) curve?(Figure 2)
Express your answer as a whole number.
Part C
Which curve corresponds to the titration of the strong acid and which one to the titration of the weak acid?
| Graph (a) represents a weak acid and graph (b) represents a strong acid. | |
| Graph (b) represents a weak acid and graph (a) represents a strong acid. |
Hd (b) 14 12 10 8 4- 2 0 0 20 40 60 80 100 Volume of base added (mL)
Step by Step Solution
3.48 Rating (161 Votes )
There are 3 Steps involved in it
PH2 an... View full answer

Get step-by-step solutions from verified subject matter experts