

Question: The graph shows a straight line segment that approximates new motor vehicle sales in the United States from 2009 to 2013. Determine the average rate
The graph shows a straight line segment that approximates new motor vehicle sales in the United States from 2009 to 2013. Determine the average rate of change from 2009 to 2013, and interpret the results.
New Vehicle Sales
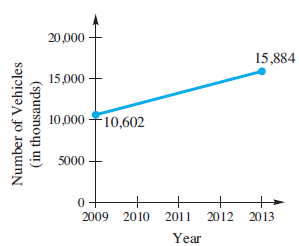
20,000 15,884 15,000- 10,000 F10,602 5000 2013 2009 2010 2011 2012 Year Number of Vehicles (in thousands)
Step by Step Solution
★★★★★
3.54 Rating (175 Votes )
There are 3 Steps involved in it
1 Expert Approved Answer
Step: 1 Unlock

The points to use are 2009 10602 and 2013 15884 The average rat... View full answer
Question Has Been Solved by an Expert!
Get step-by-step solutions from verified subject matter experts
Step: 2 Unlock
Step: 3 Unlock