

The graph shows the percent of households in the United States that were wireless-only households for the
Question:
The graph shows the percent of households in the United States that were wireless-only households for the years 2011 to 2016.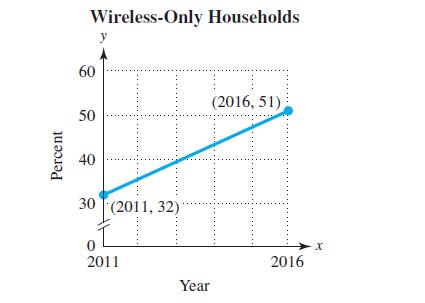
(a) In the context of this graph, what does the ordered pair (2016, 51) mean?(b) Use the given ordered pairs to find the slope of the line.(c) Interpret the slope in the context of this problem.
Fantastic news! We've Found the answer you've been seeking!
Step by Step Answer:
a In the context of this graph the ordered pair 2016 51 represents the year 2016 and th...View the full answer

Answered By
Mary Boke
I have teached the student upto class 12th as well as my fellow mates.I have a good command in engineering,maths and science.I scored 90+ marks in 10th and 12th in maths.
0 Reviews
10+ Question Solved
Related Book For 

Intermediate Algebra
ISBN: 9780134895987
13th Edition
Authors: Margaret Lial, John Hornsby, Terry McGinnis
Question Posted:
