

The data in Table 2 give the U.S. consumption of natural gas in trillions of cubic feet.
Question:
The data in Table 2 give the U.S. consumption of natural gas in trillions of cubic feet.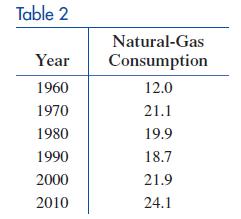
(A) Let x represent time (in years), with x = 0 corresponding to 1960, and let y represent the corresponding U.S. consumption of natural gas. Enter the data set in a graphing calculator and find a cubic regression equation for the data.
(B) If y = N(x) denotes the regression equation found in part (A), find N(60) and N′(60), and write a brief verbal interpretation of these results.
Fantastic news! We've Found the answer you've been seeking!
Step by Step Answer:
A To find a cubic regression equation for the data ...View the full answer

Answered By
BillClinton Muguai
I have been a tutor for the past 5 years. I have experience working with students in a variety of subject areas, including computer science, math, science, English, and history. I have also worked with students of all ages, from elementary school to college. In addition to my tutoring experience, I have a degree in education from a top university. This has given me a strong foundation in child development and learning theories, which I use to inform my tutoring practices.
I am patient and adaptable, and I work to create a positive and supportive learning environment for my students. I believe that all students have the ability to succeed, and it is my job to help them find and develop their strengths. I am confident in my ability to tutor students and help them achieve their academic goals.
0 Reviews
10+ Question Solved
Related Book For 

College Mathematics For Business Economics, Life Sciences, And Social Sciences
ISBN: 978-0134674148
14th Edition
Authors: Raymond Barnett, Michael Ziegler, Karl Byleen, Christopher Stocker
Question Posted:
