

Using quadratic regression on a graphing calculator, show that the quadratic function that best fits the data
Question:
Using quadratic regression on a graphing calculator, show that the quadratic function that best fits the data on market share in Problem 66 is
f(x) = -0.0117x2 + 0.32x + 17.9
Problem 66
The table shows the retail market share of passenger cars from Ford Motor Company as a percentage of the U.S. market.
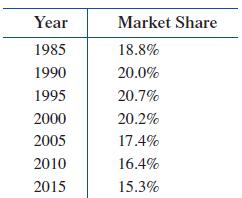
A mathematical model for this data is given by
f(x) = -0.0117x2 + 0.32x + 17.9
where x = 0 corresponds to 1980.
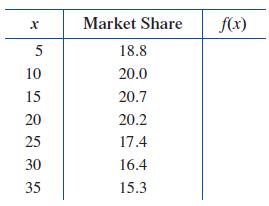
(A) Complete the following table. Round values of f(x) to one decimal place.
(B) Sketch the graph of f and the market share data in the same coordinate system.
(C) Use values of the modeling function f to estimate Ford’s market share in 2025 and in 2028.
(D) Write a brief verbal description of Ford’s market share from 1985 to 2015.
Step by Step Answer:


College Mathematics For Business Economics, Life Sciences, And Social Sciences
ISBN: 978-0134674148
14th Edition
Authors: Raymond Barnett, Michael Ziegler, Karl Byleen, Christopher Stocker
