

Question: Figure 2.66 shows the position graph for a particle for 6 s. (a) Draw the corresponding Velocity vs. Time graph. (b) What is the acceleration
Figure 2.66 shows the position graph for a particle for 6 s.
(a) Draw the corresponding Velocity vs. Time graph.
(b) What is the acceleration between 0 s and 2 s?
(c) What happens to the acceleration at exactly 2 s?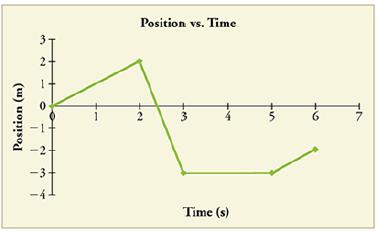
Position (m) 2 0 N 3 -4 Position vs. Time Time (s) 6 7
Step by Step Solution
★★★★★
3.45 Rating (164 Votes )
There are 3 Steps involved in it
1 Expert Approved Answer
Step: 1 Unlock

b Acceleration between 0 s and 2 s The acceleration of the particle between 0 s and 2 s can be calc... View full answer
Question Has Been Solved by an Expert!
Get step-by-step solutions from verified subject matter experts
Step: 2 Unlock
Step: 3 Unlock