

Question: FIGURE EX2.9 shows the velocity graph of a particle. Draw the particles acceleration graph for the interval 0 s ¤ t ¤ 4 s. Figure
Figure Ex 2.9
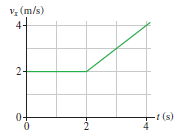
(m/s) 4+ 2- t (s) 0+ 2
Step by Step Solution
★★★★★
3.33 Rating (165 Votes )
There are 3 Steps involved in it
1 Expert Approved Answer
Step: 1 Unlock

Visualize The object has a constant velocity for 2 s and then s... View full answer
Question Has Been Solved by an Expert!
Get step-by-step solutions from verified subject matter experts
Step: 2 Unlock
Step: 3 Unlock
Document Format (2 attachments)
1442_6054778b42d8f_642058.pdf
180 KBs PDF File
1442_6054778b42d8f_642058.docx
120 KBs Word File