

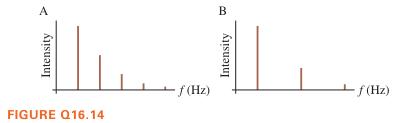
Figure Q16.14 shows frequency spectra of the same note played on a flute (modeled as an open-open
Question:
Figure Q16.14 shows frequency spectra of the same note played on a flute (modeled as an open-open tube) and on a clarinet (a closed-open tube). Which figure corresponds to the flute, and which to the clarinet? Explain.
Fantastic news! We've Found the answer you've been seeking!
Step by Step Answer:

Answered By
PALASH JHANWAR
I am a Chartered Accountant with AIR 45 in CA - IPCC. I am a Merit Holder ( B.Com ). The following is my educational details.
PLEASE ACCESS MY RESUME FROM THE FOLLOWING LINK: https://drive.google.com/file/d/1hYR1uch-ff6MRC_cDB07K6VqY9kQ3SFL/view?usp=sharing
3+ Reviews
10+ Question Solved
Related Book For 
College Physics A Strategic Approach
ISBN: 9780134779218
4th Edition
Authors: Randall D. Knight, Brian Jones
Question Posted:
