

Question: In Figure 21.40, does the graph indicate the time constant is shorter for discharging than for charging? Would you expect ionized gas to have low
In Figure 21.40, does the graph indicate the time constant is shorter for discharging than for charging? Would you expect ionized gas to have low resistance? How would you adjust to get a longer time between flashes? Would adjusting R affect the discharge time?
Data given in Figure 21.40
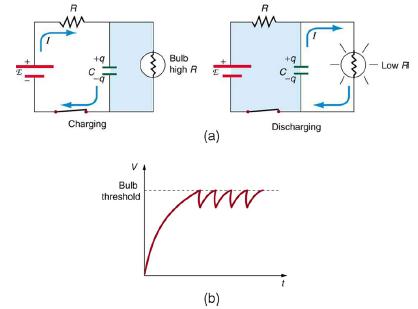
R +q Charging Bulb threshold www Bulb high R (a) ww (b) R +9 I Discharging - Low A
Step by Step Solution
3.33 Rating (162 Votes )
There are 3 Steps involved in it
Does the graph indicate the time constant is shorter for discharging than for charging Yesthe graph indicates that the time constant is shorter for di... View full answer

Get step-by-step solutions from verified subject matter experts