

Question: Figure P22.78 (left) shows an AC voltage source connected to a capacitor. The graphs on the right show the current as a function of time
Figure P22.78 (left) shows an AC voltage source connected to a capacitor. The graphs on the right show the current as a function of time for two values of the capacitance C1 and C2. What is the approximate ratio C2/C1.
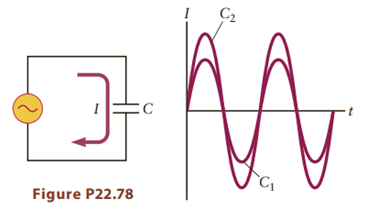
C2 Figure P22.78
Step by Step Solution
★★★★★
3.27 Rating (156 Votes )
There are 3 Steps involved in it
1 Expert Approved Answer
Step: 1 Unlock

If the voltage and frequency are constant the current through a capacitor ... View full answer
Question Has Been Solved by an Expert!
Get step-by-step solutions from verified subject matter experts
Step: 2 Unlock
Step: 3 Unlock