

Question: Use the data in Figure 13.4 to determine the approximate frequency at which the human ear is most sensitive to sound. Figure 13.4 Onset of
Use the data in Figure 13.4 to determine the approximate frequency at which the human ear is most sensitive to sound.
Figure 13.4
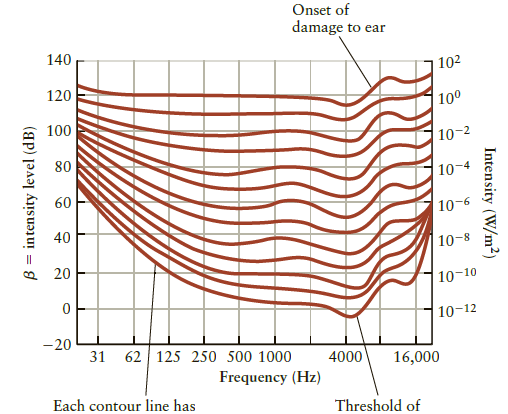
Onset of damage to ear 140 102 120 100 100 10-2 80 10-4 60 10-6 40 10-8 10-10 10-12 -20 31 62 125 250 500 1000 4000 16,000 Frequency (Hz) Each contour line has Threshold of Intensity (W/m2) 20 B = intensity level (dB)
Step by Step Solution
★★★★★
3.34 Rating (160 Votes )
There are 3 Steps involved in it
1 Expert Approved Answer
Step: 1 Unlock

Figure 134 graphs the intensity of a sound vs the frequency Refer to Figur... View full answer
Question Has Been Solved by an Expert!
Get step-by-step solutions from verified subject matter experts
Step: 2 Unlock
Step: 3 Unlock