

Question: Using a graphical approach (i.e., by estimating the slope at various points), find the qualitative behavior of the acceleration as a function of time for
Figure P2.28
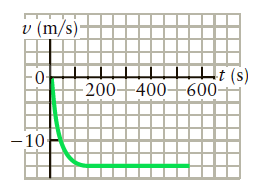
v (m/s)- Ht (s) 0- - 200400-600- -10-
Step by Step Solution
★★★★★
3.33 Rating (159 Votes )
There are 3 Steps involved in it
1 Expert Approved Answer
Step: 1 Unlock

Apply graphical analysis of motion and specifically the definition of acceleration Use Figure P228 a... View full answer
Question Has Been Solved by an Expert!
Get step-by-step solutions from verified subject matter experts
Step: 2 Unlock
Step: 3 Unlock