

Question: For the object described by the velocitytime graph in Figure P2.29, estimate the average acceleration over the interval from t - 0 s to t
Figure P2.29
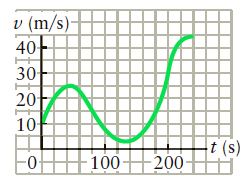
v (m/s) 40- 30 20 10- t (s) -0- 200 100
Step by Step Solution
★★★★★
3.39 Rating (146 Votes )
There are 3 Steps involved in it
1 Expert Approved Answer
Step: 1 Unlock

This problem requires the determination of acceleration from a ve... View full answer
Question Has Been Solved by an Expert!
Get step-by-step solutions from verified subject matter experts
Step: 2 Unlock
Step: 3 Unlock