

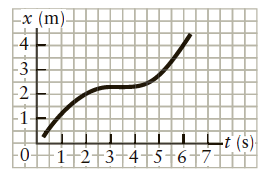
Question: Repeat Problem 24 using the positiontime graph in Figure P2.26. Figure P2.26 Data From Problem 24 Consider the positiontime graph shown in Figure P2.24. Make
Figure P2.26
Data From Problem 24
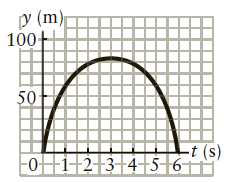
Consider the position€“time graph shown in Figure P2.24. Make a careful graphical estimate of the velocity as a function of time by measuring the slopes of tangent lines. What is an approximate value of the maximum velocity of the object?
Figure P2.24
y (m) 100+ 50 -t (s) -0+i+2-3+4+5-6+| -x (m) -3- -2- -1 Hi (s) -0+i-2-3-4-5-6-7- 4)
Step by Step Solution
★★★★★
3.54 Rating (161 Votes )
There are 3 Steps involved in it
1 Expert Approved Answer
Step: 1 Unlock

Apply graphical analysis of motion including the definition of velocity as the rate of change of pos... View full answer
Question Has Been Solved by an Expert!
Get step-by-step solutions from verified subject matter experts
Step: 2 Unlock
Step: 3 Unlock