All Matches
Solution Library
Expert Answer
Textbooks
Search Textbook questions, tutors and Books
Oops, something went wrong!
Change your search query and then try again
Toggle navigation
FREE Trial
S
Books
FREE
Tutors
Study Help
Expert Questions
Accounting
General Management
Mathematics
Finance
Organizational Behaviour
Law
Physics
Operating System
Management Leadership
Sociology
Programming
Marketing
Database
Computer Network
Economics
Textbooks Solutions
Accounting
Managerial Accounting
Management Leadership
Cost Accounting
Statistics
Business Law
Corporate Finance
Finance
Economics
Auditing
Hire a Tutor
AI Study Help
New
Search
Search
Sign In
Register
study help
computer science
data mining concepts and techniques
Questions and Answers of
Data Mining Concepts And Techniques
The traditional machine learning approach usually needs human experts to label the data examples (e.g., document, images, signals, etc.) to train a model to perform classification or regression. The
In zero-shot learning, the model observes test samples from classes that were not observed during training, and needs to predict the category they belong to. Formally, the training data has a label
In streaming data classification, there is an infinite sequence of the form \((\mathbf{x}, y)\). The goal is to find a function \(y=f(\mathbf{x})\) that can predict the label \(y\) for an unseen
Suppose we are given \(M\) temporal sequences \(S=\left\{\boldsymbol{x}^{(\mathbf{1})}, \ldots, \boldsymbol{x}^{(\boldsymbol{M})}ight\}\), where each temporal sequence
Given 20 data points in 2-D space whose first principal component is \(u=\left(\frac{1}{\sqrt{2}}, \frac{1}{\sqrt{2}}ight)^{\prime}\).a. Suppose we add one more data point at \((2,2)^{\prime}\); how
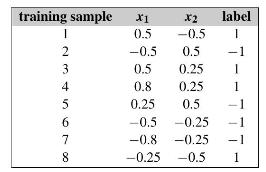
Given \(n\) training examples \(\left(\mathbf{x}_{i}, y_{i}ight)(i=1,2, \ldots, n)\) where \(\mathbf{x}_{i}\) is the feature vector of \(i\) th training example and \(y_{i}\) is its label, we
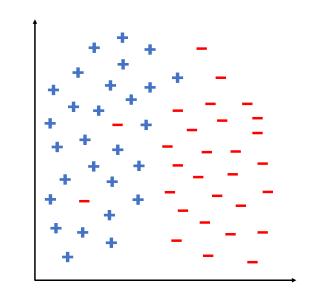
Distance metric learning aims to learn a distance metric that best describe the distance between two data points. One of the most commonly used distance metric is Mahalanobis distance. It is of the
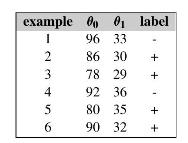
Feature selection aims to select a subset of features that will be used in training. In general, there are three major types of feature selection strategy: filter method, wrapper method and embedded
The support vector machine is a highly accurate classification method. However, SVM classifiers suffer from slow processing when training with a large set of data tuples. Discuss how to overcome this
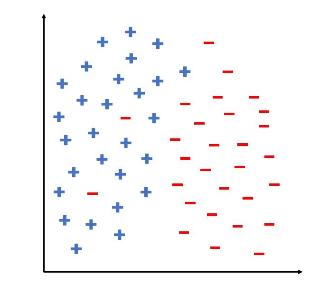
Compare and contrast associative classification and discriminative frequent pattern-based classification. Why is classification based on frequent patterns able to achieve higher classification
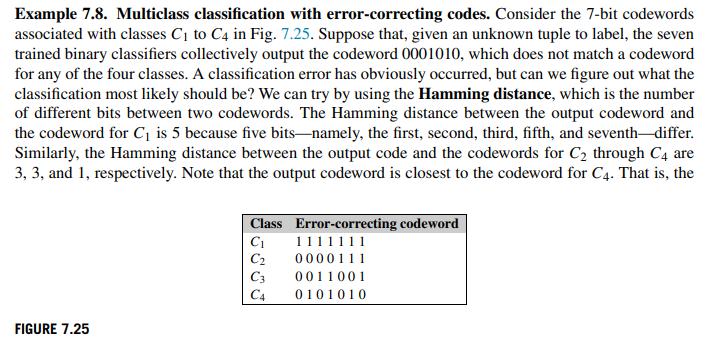
Example 7.8 showed the use of error-correcting codes for a multiclass classification problem having four classes.a. Suppose that, given an unknown tuple to label, the seven trained binary classifiers
Semisupervised classification, active learning, and transfer learning are useful for situations in which unlabeled data are abundant.a. Describe semisupervised classification, active learning, and
Machine learning and data mining techniques have great potential in automatic decision making. Despite the success in deploying these techniques, many end-users do not understand how the decisions
For graph mining using random walk with restart (RWR), the formula is \(\mathbf{r}_{i}=c \tilde{W} \mathbf{r}_{i}+(1-c) \mathbf{e}_{i}\), where the ranking vector \(\mathbf{r}_{i}\) will start the
Briefly describe the (a) classification and (b) feature selection steps in the genetic algorithm.
Both reinforcement learning (RL) and the multiarmed bandit (MAB) are well known for modeling the interactions between agents and outside environments in order to achieve the maximum rewards.
Briefly describe and give examples of each of the following approaches to clustering: partitioning methods, hierarchical methods, density-based and grid-based methods, and bi-clustering methods.
Suppose that the data mining task is to cluster points (with \((x, y)\) representing location) into three clusters, where the points are\[A_{1}(2,10), A_{2}(2,5), A_{3}(8,4), B_{1}(5,8), B_{2}(7,5),
Use an example to show why the \(k\)-means algorithm may not find the global optimum, that is, optimizing the within-cluster variation.
For the \(k\)-means algorithm, it is interesting to note that by choosing the initial cluster centers carefully, we may be able to not only speed up the algorithm's convergence, but also guarantee
Provide the pseudocode of the object reassignment step of the PAM algorithm.
Both \(k\)-means and \(k\)-medoids algorithms can perform effective clustering.a. Illustrate the strength and weakness of \(k\)-means in comparison with \(k\)-medoids.b. Illustrate the strength and
Show that the single-linkage method is equivalent to taking \(\alpha_{i}=\alpha_{j}=0.5, \beta=0\), and \(\gamma=-0.5\) in the Lance-Williams formula; the complete-linkage method is equivalent to
Prove that in DBSCAN*, the density-connectedness is an equivalence relation.
Prove that in DBSCAN*, for a fixed Min Pts value and two neighborhood thresholds, \(\epsilon_{1}
Provide the pseudocode of the OPTICS algorithm.
Why is it that BIRCH encounters difficulties in finding clusters of arbitrary shape but OPTICS does not? Propose modifications to BIRCH to help it find clusters of arbitrary shape.
Provide the pseudocode of the step in CLIQUE that finds dense cells in all subspaces.
Present conditions under which density-based clustering is more suitable than partitioning-based clustering and hierarchical clustering. Give application examples to support your argument.
Give an example of how specific clustering methods can be integrated, for example, where one clustering algorithm is used as a preprocessing step for another. In addition, provide reasoning as to why
Clustering is recognized as an important data mining task with broad applications. Give one application example for each of the following cases:a. An application that uses clustering as a major data
Data cubes and multidimensional databases contain nominal, ordinal, and numeric data in hierarchical or aggregate forms. Based on what you have learned about the clustering methods, design a
Describe each of the following clustering algorithms in terms of the following criteria: (1) shapes of clusters that can be determined; (2) input parameters that must be specified; and (3)
Human eyes are fast and effective at judging the quality of clustering methods for \(2-D\) data. Can you design a data visualization method that may help humans visualize data clusters and judge the
Discuss how well purity, entropy, and the method using Jacaard coefficient satisfy the four essential requirements for extrinsic clustering evaluation methods.
Traditional clustering methods are rigid in that they require each object to belong exclusively to only one cluster. Explain why this is a special case of fuzzy clustering. You may use k-means as an
An e-commerce company carries 1000 products, \(P_{1}, \ldots, P_{1000}\). Consider customers Ada, Bob, and Cathy such that Ada and Bob purchase three products in common, \(P_{1}, P_{2}\), and
Can you show that the \(k\)-medoids method can also be implemented in the EM algorithm framework?
In the \(\mathrm{EM}\) algorithm for mixture models, if for all univariate Gaussian distributions \(\Theta_{j}(1 \leq j \leq\) \(k), \sigma_{j}=\sigma\), that is, all have the standard deviation. Can
Show that \(I \times J\) is a bicluster with coherent values if and only if, for any \(i_{1}, i_{2} \in I\) and \(j_{1}, j_{2} \in J\), \(e_{i_{1} j_{1}}-e_{i_{2} j_{1}}=e_{i_{1} j_{2}}-e_{i_{2}
In soft projected clustering method LAC, explain how the weights and the clusters can be computed using the EM algorithm.
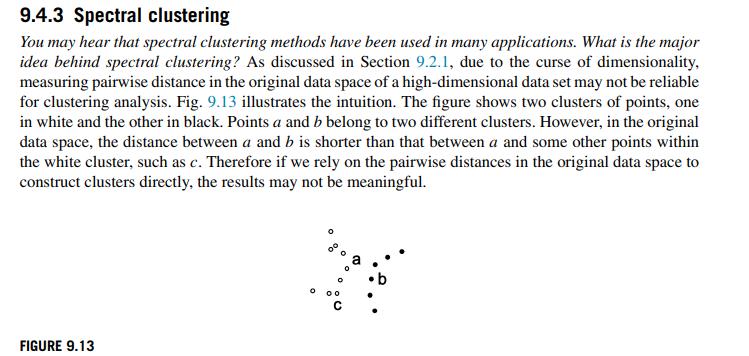
In this exercise, we will learn about the mathematical details underlying many spectral clustering methods (Section 9.4.3). Given an n×nn×n similarity matrix WW whose elements are the similarities
SimRank is a similarity measure for clustering graph and network data.a. Prove \(\lim _{i ightarrow \infty} s_{i}(u, v)=s(u, v)\) for SimRank computation.b. Show \(s(u, v)=p(u, v)\) for SimRank.
In a large sparse graph where on average each node has a low degree, is the similarity matrix using SimRank still sparse? If so, in what sense? If not, why? Deliberate on your answer.
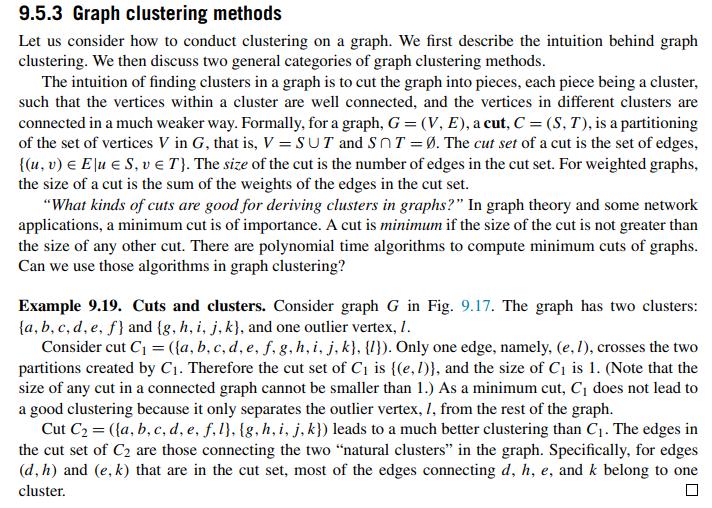
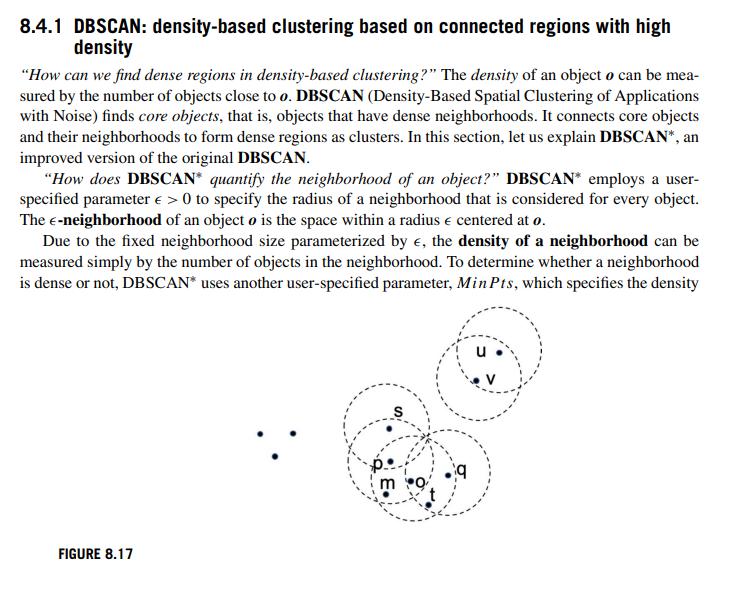
Compare the SCAN algorithm (Section 9.5.3) with DBSCAN (Section 8.4.1). What are their similarities and differences? 9.5.3 Graph clustering methods Let us consider how to conduct clustering on a
Consider partitioning clustering and the following constraint on clusters: The number of objects in each cluster must be between \(\frac{n}{k}(1-\delta)\) and \(\frac{n}{k}(1+\delta)\), where \(n\)
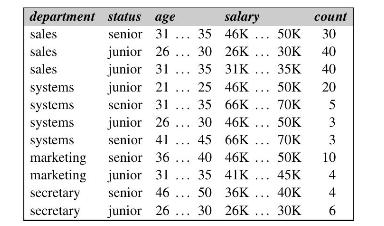
The following table consists of training data from an employee database. The data have been generalized. For example, "31 ... 35" for age represents the age range of 31 to 35 . For a given row entry,
a. Derivatives of various activation functions. Show how the derivatives of activation functions, including sigmoid, tanh, and ELU in Table 10.6, are derived in mathematical details.b.
Feed-forward neural networks. In this exercise, we implement a feed-forward neural network for a binary classification task. The goal is to predict whether the e-mail is spam (labeled as 1) or not
Autoencoder. Autoencoder is a classic type of neural networks for unsupervised learning.a. Demonstrate that PCA is a special case of the autoencoder by showing that the loss function of PCA is
Dropout. (a) Explain why dropout can be used to mitigate the overfitting problem. (b) Suppose we have a simple two-layer neural network y=W2(W1x+b1)+b2y=W2(W1x+b1)+b2 where
Pretraining on autoencoder.a. Why pretraining helps the learning or converge?b. How to pretrain an autoencoder?
Loss functions. Consider the following two loss functions, including (1) mean-squared error Loss(T,O)=12(T−O)2Loss(T,O)=12(T−O)2, and (2) cross-entropy
What are the key differences between CNNs and feed-forward neural networks? Why are CNNs widely used on grid-like data?
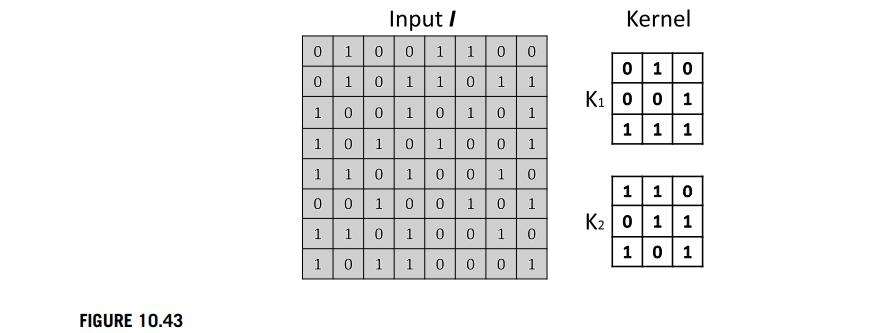
2-D convolution. Given the input and two kernels as shown in Fig. 10.43,a. compute the feature maps by applying kernel K1,K2K1,K2 (stride is defined as 1 , and zeros are padded around II ),
Training LSTM. It is usually hard to train LSTM on long sequences, answer the following questions:a. Why it is hard to train LSTM?b. How to mitigate the problem?
LSTM and GRU Compare LSTM with GRU, and answer the following questions:a. What do they have in common?b. What are the differences between them?c. What are the pros and cons of them?
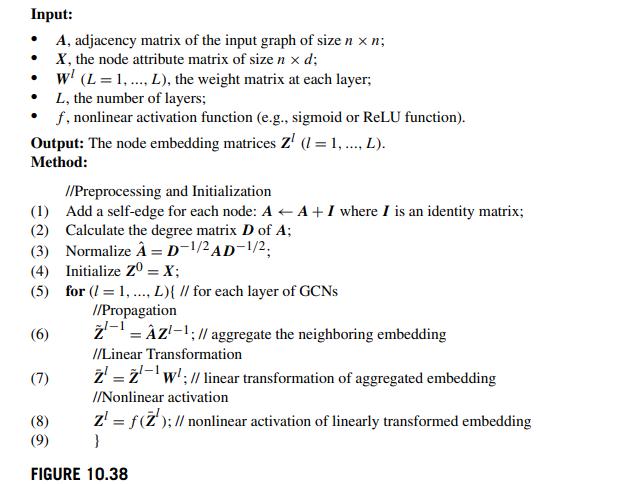
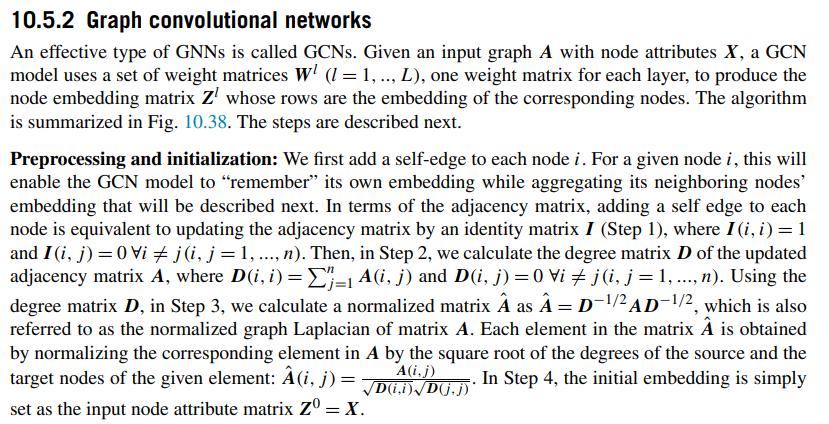
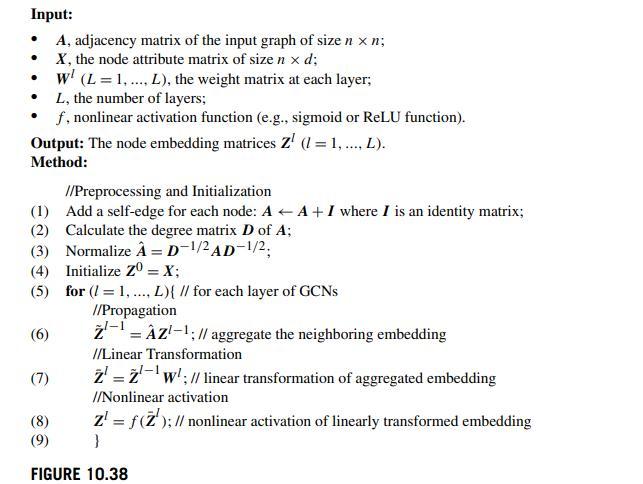
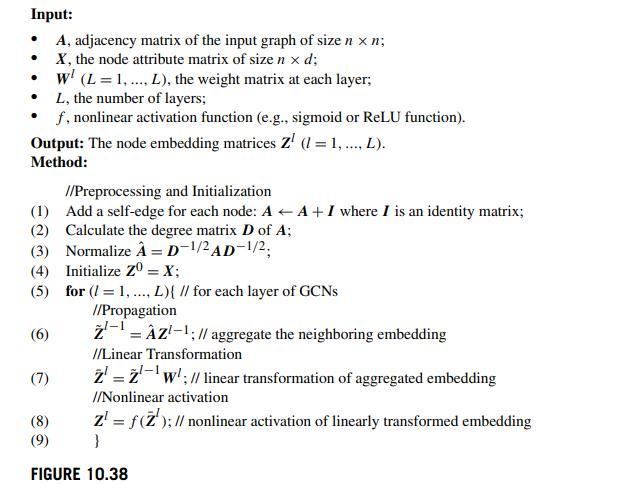
Suppose we apply graph convolutional networks (GCNs) on grid-like graphs (e.g., images) without normalizing adjacency matrix (i.e., removing Steps 2-3 in Fig. 10.38). Explain why it is essentially a
In this exercise, we will derive the graph convolutional networks shown in Sec. 10.5.2 from spectral graph signal processing perspective. The classic convolution on graphs can be computed by
In this exercise, we aim to implement and learn the graph convolutional networks (GCNs) shown in Fig. 10.38. Specifically, we apply a two-layer GCN for semisupervised node classification on Cora data
Give an application example where global outliers, contextual outliers, and collective outliers are all interesting. What are the attributes, and what are the contextual and behavioral attributes?
Give an application example of where the border between normal objects and outliers is often unclear, so that the degree to which an object is an outlier has to be well estimated.
Adapt a simple semisupervised method for outlier detection. Discuss the scenario where you have (a) only some labeled examples of normal objects and (b) only some labeled examples of outliers.
Using an equal-depth histogram, design a way to assign an object an outlier-ness score.
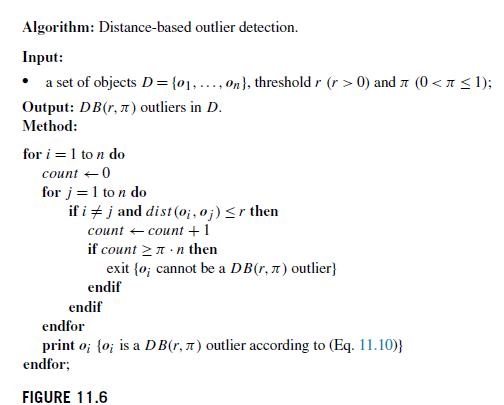
Consider the nested loop approach to mining distance-based outliers (Fig. 11.6). Suppose the objects in a data set are arranged randomly; that is, each object has the same probability to appear in a
In the density-based outlier detection method of Section 11.3.2, the definition of local reachability density has a potential problem: \(\operatorname{lr} d_{k}(o)=\infty\) may occur. Explain why
Because clusters may form a hierarchy, outliers may belong to different granularity levels. Propose a clustering-based outlier detection method that can find outliers at different levels.
In outlier detection by semisupervised learning, what is the advantage of using objects without labels in the training data set?
Given a user-community bipartite graph, where the nodes are users and communities, and links indicate the membership between users and communities. We can represent this bipartite graph by its
Describe a method to integrate support vector data description (SVDD) and deep learning for outlier detection.
To understand why angle-based outlier detection is a heuristic method, give an example where it does not work well. Can you come up with a method to overcome this issue?
Give three additional commonly used statistical measures that are not already illustrated in this chapter for the characterization of data dispersion. Discuss how they can be computed efficiently in
Suppose that the data for analysis includes the attribute age. The age values for the data tuples are (in increasing order) 13, 15, 16, 16, 19, 20, 20, 21, 22, 22, 25, 25, 25, 25, 30, 33, 33, 35, 35,
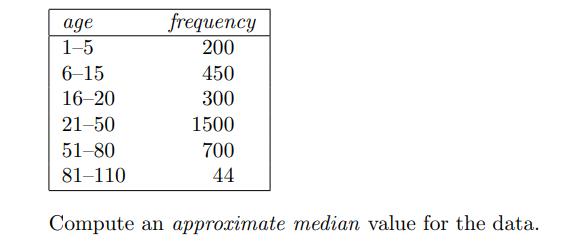
Suppose that the values for a given set of data are grouped into intervals. The intervals and corresponding frequencies are as follows: age 1-5 6-15 16-20 21-50 51-80 81-110 frequency 200 450 300
How is a quantile-quantile plot different from a quantile plot?
In our text, we state that the variance of N observations, x1, x2, . . . , xN (when N is large), for a numeric attribute X is defined aswhere X̅ is the mean value of the observations, as defined in
Reason why variance and standard deviation can be computed efficiently in very large sets.
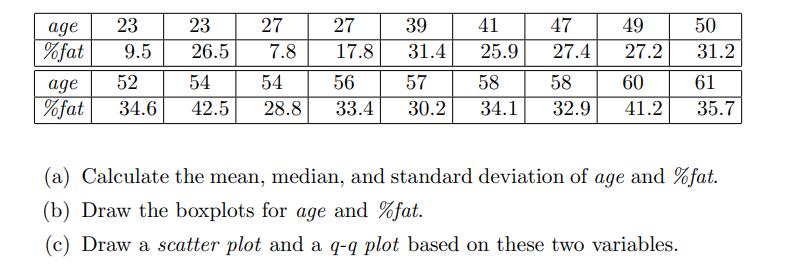
Suppose that a hospital tested the age and body fat data for 18 randomly selected adults with the following results: age % fat age % fat 23 9.5 23 26.5 52 54 34.6 42.5 27 7.8 27 17.8 54 56 28.8 33.4
Briefly outline how to compute the dissimilarity between objects described by the following:(a) Nominal attributes(b) Asymmetric binary attributes(c) Numeric attributes(d) Term-frequency vectors
Given two objects represented by the tuples (22, 1, 42, 10) and (20, 0, 36, 8):(a) Compute the Euclidean distance between the two objects.(b) Compute the Manhattan distance between the two
The median is one of the most important holistic measures in data analysis. Propose several methods for median approximation. Analyze their respective complexity under different parameter settings
It is important to define or select similarity measures in data analysis. However, there is no commonly accepted subjective similarity measure. Results can vary depending on the similarity measures
Data quality can be assessed in terms of several issues, including accuracy, completeness, and consistency. For each of the above three issues, discuss how data quality assessment can depend on the
In real-world data, tuples with missing values for some attributes are a common occurrence. Describe various methods for handling this problem.
Given the following data (in the increasing order) for the attribute age: 13, 15, 16, 16, 19, 20, 20, 21, 22, 22, 25, 25, 25, 25, 30, 33, 33, 35, 35, 35, 35, 36, 40, 45, 46, 52, 70.(a) Use smoothing
Discuss issues to consider during data integration.
What are the value ranges of the following normalization methods?(a) min-max normalization(b) z-score normalization(c) z-score normalization using the mean absolute deviation instead of standard
Use these methods to normalize the following group of data:200, 300, 400, 600, 1000(a) Min-max normalization by setting min = 0 and max = 1(b) Z-score normalization(c) Z-score normalization using the
Using the data for age given in Exercise 3.14, answer the following:(a) Use min-max normalization to transform the value 35 for age onto the range [0.0, 1.0].(b) Use z-score normalization to
Using the data for age and body fat given in Exercise 3.4, answer the following:(a) Normalize the two attributes based on z-score normalization.(b) Calculate the correlation coefficient (Pearson’s
Suppose a group of 12 sales price records has been sorted as follows: 5, 10, 11, 13, 15, 35, 50, 55, 72, 92, 204, 215. Partition them into three bins by each of the following methods:(a)
Use a flowchart to summarize the following procedures for attribute subset selection:(a) Stepwise forward selection(b) Stepwise backward elimination(c) A combination of forward selection and
Using the data for age given in Exercise 3.14,(a) Plot an equal-width histogram of width 10.(b) Sketch examples of each of the following sampling techniques: SRSWOR, SRSWR, cluster sampling, and
Robust data loading poses a challenge in database systems because the input data are often dirty. In many cases, an input record may miss multiple values; some records could be contaminated, with
Consider the data about students, instructors, courses, and departments in a college setting. When such data is used as operational data, please give three example operations. If we want to build a
Use one example to discuss how data mart, enterprise data warehouse, and machine learning applications can be connected and build up one over another.
Is it possible that an enterprise runs both a data warehouse and a data lake? If so, what is the relation between the data warehouse and the data lake? Can you describe one scenario where maintaining
Suppose that a data warehouse consists of the three dimensions time, doctor, and patient, and the two measures count and charge, where charge is the fee that a doctor charges a patient for a visit.a.
Suppose that a data warehouse for Big_University consists of the four dimensions student, course, semester, and instructor, and two measures count and avg_grade. At the lowest conceptual level (e.g.,
Suppose that a data warehouse consists of the four dimensions date, spectator, location, and game, and the two measures count and charge, where charge is the fare that a spectator pays when watching
Showing 1 - 100
of 186
1
2