

Question: Using a software tool, such as a spreadsheet program, compute the average deviation, standard deviation, and variance for the raw data presented in Exercise 6.8.
Using a software tool, such as a spreadsheet program, compute the average deviation, standard deviation, and variance for the raw data presented in Exercise 6.8.
Exercise 6.8
Given the following data for three projects, perform the complete data analysis as was done for Table 6.2. How would you perform the average cross-check in the cell marked "XXX"?
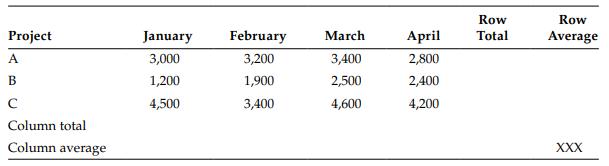
Table 6.2
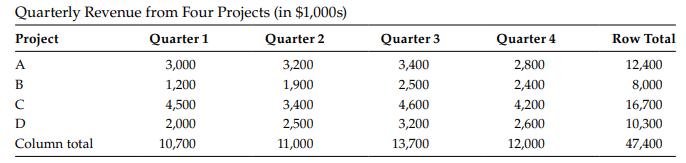
Row Row Project January February March April Total Average A 3,000 3,200 3,400 2,800 B 1,200 1,900 2,500 2,400 C 4,500 3,400 4,600 4,200 Column total Column average XXX
Step by Step Solution
There are 3 Steps involved in it
1 Expert Approved Answer
Step: 1 Unlock

Question Has Been Solved by an Expert!
Get step-by-step solutions from verified subject matter experts
Step: 2 Unlock
Step: 3 Unlock