

Question: Plot the step response for Problem 4 using MATLAB. From your plots, find the time constant, rise time, and settling time. Data from Problem 4:
Plot the step response for Problem 4 using MATLAB. From your plots, find the time constant, rise time, and settling time.
Data from Problem 4:
Find the capacitor voltage in the network shown in Figure P4.2 if the switch closes at t = 0. Assume zero initial conditions. Also find the time constant, rise time, and settling time for the capacitor voltage.
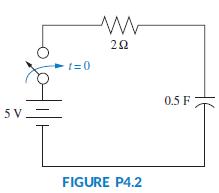
20 t=0 0.5 F 5 V . FIGURE P4.2
Step by Step Solution
★★★★★
3.43 Rating (169 Votes )
There are 3 Steps involved in it
1 Expert Approved Answer
Step: 1 Unlock

Define the circuit parameters resistance R capacitance C and voltage source V R 2 C 05 V 5 Define th... View full answer
Question Has Been Solved by an Expert!
Get step-by-step solutions from verified subject matter experts
Step: 2 Unlock
Step: 3 Unlock