

Question: Plot the step responses for Problem 2 using MATLAB. Data From Problem 2: Find the output response, c(t), for each of the systems shown in
Plot the step responses for Problem 2 using MATLAB.
Data From Problem 2:
Find the output response, c(t), for each of the systems shown in Figure P4.1. Also find the time constant, rise time, and settling time for each case.
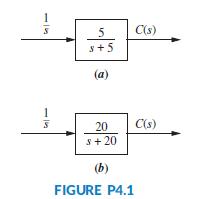
5 C(s) s+5 (a) 20 C(s) s+ 20 (b) FIGURE P4.1
Step by Step Solution
★★★★★
3.27 Rating (179 Votes )
There are 3 Steps involved in it
1 Expert Approved Answer
Step: 1 Unlock

analyze the response of the control systems in both the time domain and the frequency domain We will ... View full answer
Question Has Been Solved by an Expert!
Get step-by-step solutions from verified subject matter experts
Step: 2 Unlock
Step: 3 Unlock