

Question: The open-loop frequency response shown in Figure P10.8 was experimentally obtained from a unity feedback system. Estimate the percent overshoot and steady-state error of the
The open-loop frequency response shown in Figure P10.8 was experimentally obtained from a unity feedback system. Estimate the percent overshoot and steady-state error of the closed-loop system.
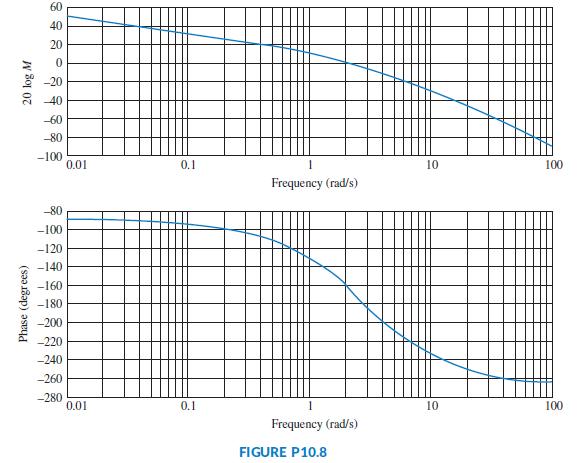
60 40 20 -20 2 40 -60 -80 -100 0.01 0.1 10 100 Frequency (rad/s) -80 -100 -120 -140 -160 -180 -200 -220 -240 -260 -280 0.01 0.1 10 100 Frequency (rad/s) FIGURE P10.8 Phase (degrees) 20 log M
Step by Step Solution
★★★★★
3.40 Rating (159 Votes )
There are 3 Steps involved in it
1 Expert Approved Answer
Step: 1 Unlock

The openloop frequency response shown in Figure P108 can be approximated by a secondorder transfer f... View full answer
Question Has Been Solved by an Expert!
Get step-by-step solutions from verified subject matter experts
Step: 2 Unlock
Step: 3 Unlock