

Question: Draw the state transition diagram for this down counter, and compare it with the diagram of Figure 5-50. How are they different? Figure 5-50 110
Draw the state transition diagram for this down counter, and compare it with the diagram of Figure 5-50. How are they different?
Figure 5-50
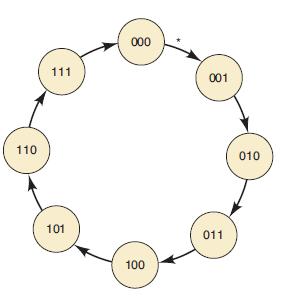
110 111 101 000 100 001 011 010
Step by Step Solution
★★★★★
3.42 Rating (152 Votes )
There are 3 Steps involved in it
1 Expert Approved Answer
Step: 1 Unlock

Question Has Been Solved by an Expert!
Get step-by-step solutions from verified subject matter experts
Step: 2 Unlock
Step: 3 Unlock