

Question: Using the tea_15.sav data from Chapter 4 (Task 7), plot a scatterplot showing the number of cups of tea drunk (x-axis) against cognitive functioning (y-axis).
Using the tea_15.sav data from Chapter 4 (Task 7), plot a scatterplot showing the number of cups of tea drunk (x-axis) against cognitive functioning (y-axis).
Chapter 4 Task 7
One of my favourite activities, especially when trying to do brain-melting things like writing statistics books, is drinking tea. I am English, after all. Fortunately, tea improves your cognitive function – well, it does in older Chinese people at any rate (Feng et al., 2010). I may not be Chinese and I’m not that old, but I nevertheless enjoy the idea that tea might help me think. Here are some data based on Feng et al.’s study that measured the number of cups of tea drunk and cognitive functioning in 15 people. Enter these data into SPSS and save the file as tea_15.sav.
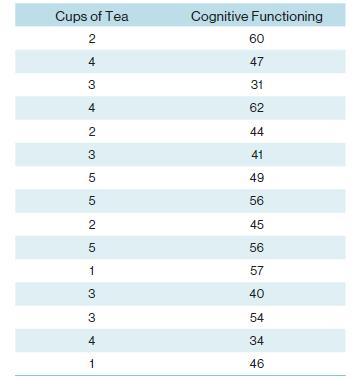
Cups of Tea Cognitive Functioning 2 4 3 60 47 31 4 62 44 2355 25 41 49 56 45 56 1 57 3 40 3 54 4 34 1 46
Step by Step Solution
3.32 Rating (155 Votes )
There are 3 Steps involved in it

Get step-by-step solutions from verified subject matter experts