

Question: Test for cross-section dependence for the Gasoline example (as in problem 13.4). Do the same for the Public Capital example. What do you conclude? Data
Test for cross-section dependence for the Gasoline example (as in problem 13.4). Do the same for the Public Capital example. What do you conclude?
Data From Problem 13.4:
For the Grunfeld example, replicate Tables 13.6, 13.7 and 13.8, i.e., (i) obtain the Breusch and Pagan test based on the fixed effects residuals using Stata's command xttest2. (ii) obtain Pesaran's CD test based on fixed effects residuals using Stata's command xtcsd. (iii) Finally using EViews obtain the Breusch-Pagan test, Pesaran's CD test, PUY's \(L M\) test which appears in EViews as Pesaran scaled LM test, also the Baltagi, Feng and Kao (2012) Bias-corrected scaled LM test, all based on fixed effects residuals. What do you conclude?
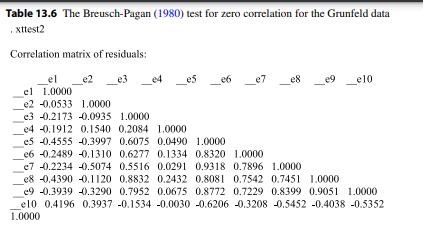
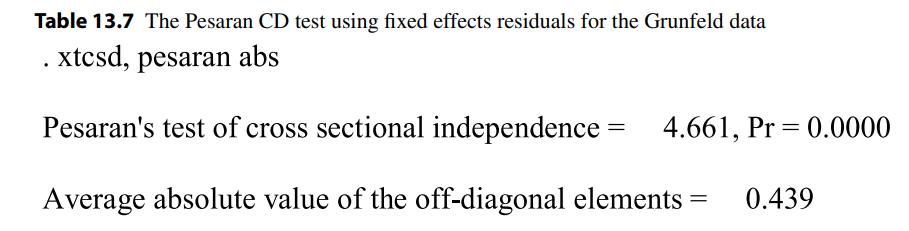
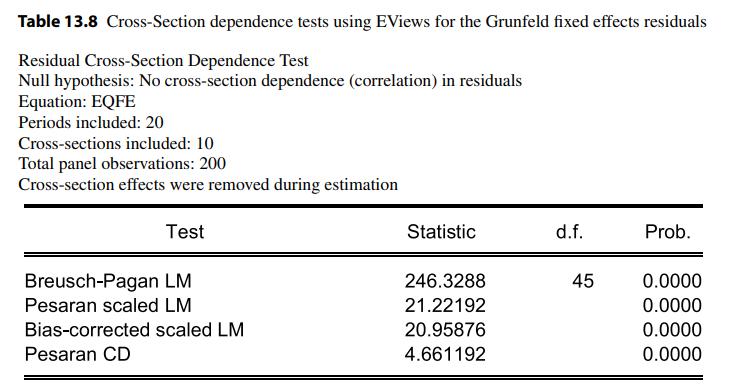
Table 13.6 The Breusch-Pagan (1980) test for zero correlation for the Grunfeld data . xttest2 Correlation matrix of residuals: el e2 e3 e4 e5 06 e7 e8 e10 el 1.0000 e2 -0.0533 1.0000 e3 0.2173 -0.0935 1.0000 e4 -0.1912 0.1540 0.2084 1.0000 e5 -0.4555 -0.3997 0.6075 0.0490 1.0000 e6 -0.2489 -0.1310 0.6277 0.1334 0.8320 1.0000 e7 -0.2234 -0.5074 0.5516 0.0291 0.9318 0.7896 1.0000 e8 -0.4390 -0.1120 0.8832 0.2432 0.8081 0.7542 0.7451 1.0000 e9 -0.3939 -0.3290 0.7952 0.0675 0.8772 0.7229 0.8399 0.9051 1.0000 e10 0.4196 0.3937 -0.1534 -0.0030 -0.6206 -0.3208 -0.5452 -0.4038 -0.5352 1.0000
Step by Step Solution
There are 3 Steps involved in it

Get step-by-step solutions from verified subject matter experts