

Figure 21.5 shows average annual growth rates in real GDP per hour worked in the United States
Question:
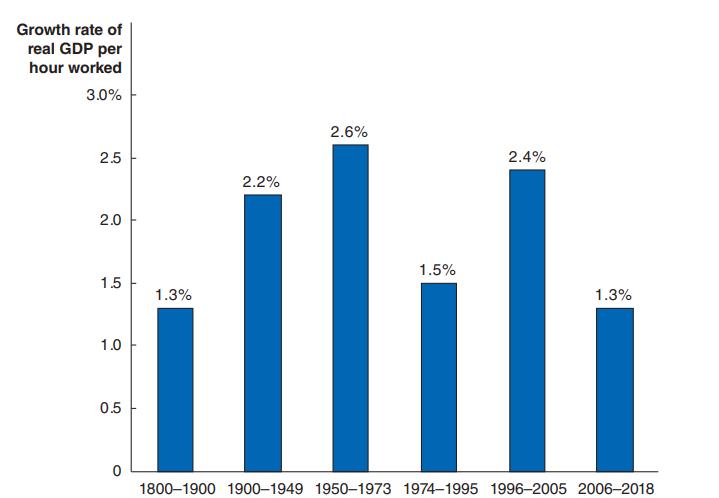
Figure 21.5 shows average annual growth rates in real GDP per hour worked in the United States for various periods from 1800 onward. How might the growth rates in the figure be different if they were calculated for real GDP per capita instead of per hour worked?
Data in Figure 21.5
Fantastic news! We've Found the answer you've been seeking!
Step by Step Answer:
If the growth rates in Figure 215 were calculated for real GDP per capita instead of per hour worked ...View the full answer

Answered By
Rishabh Ojha
During my undergraduate i used to participate as TA (Teaching Assistant) in several electronics and computers subject. I'm passionate about learning Computer Science as my bachelors are in Electronics but i learnt most of the Computer Science subjects on my own which Machine Learning also. At Present, i'm a working professional pursuing my career as a Machine Learning Engineer and i want to help others learn during my free hours, that's all the motivation behind giving tuition. To be frank i have no prior experience of tutoring but i have solved problems on opensource platforms like StackOverflow and github. ~Thanks
3+ Reviews
10+ Question Solved
Related Book For 

Question Posted:
