Suppose that the following table gives data on the price of rye and the number of bushels
Question:
Suppose that the following table gives data on the price of rye and the number of bushels of rye sold in 2019 and 2020.
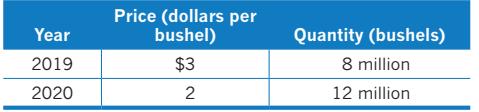
a. Calculate the change in the quantity of rye demanded divided by the change in the price of rye. Measure the quantity of rye in bushels.
b. Calculate the change in the quantity of rye demanded divided by the change in the price of rye but this time measure the quantity of rye in millions of bushels. Compare your answer to the one you computed in (a).
c. Assuming that the demand curve for rye did not shift between 2019 and 2020, use the information in the table to calculate the price elasticity of demand for rye. Use the midpoint formula in your calculation. Compare the value for the price elasticity of demand to the values you calculated in (a) and (b).
Step by Step Answer:
a To calculate the change in the quantity of rye demanded divided by the change in the price of rye ...View the full answer