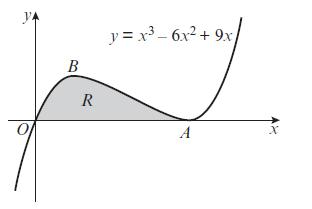
The diagram shows part of the curve with equation y = x 3 6x 2 +
Question:
The diagram shows part of the curve with equation y = x3 − 6x2 + 9x. The curve touches the x‑axis at A and has a local maximum at B.
a. Show that the equation of the curve may be written as y = x(x − 3)2, and hence write down the coordinates of A.
b. Find the coordinates of B.
c. The shaded region R is bounded by the curve and the x-axis. Find the area of R.

Fantastic news! We've Found the answer you've been seeking!
Step by Step Answer:
Related Book For 

Edexcel AS And A Level Mathematics Pure Mathematics Year 1/AS
ISBN: 9781292183398
1st Edition
Authors: Greg Attwood
Question Posted:


