

Question: Consider the following data set. a. Draw a graph similar to Fig. 3.5. Fig. 3.5 b. Compare the percentage of the observations that actually lie
Consider the following data set.
a. Draw a graph similar to Fig. 3.5.
Fig. 3.5
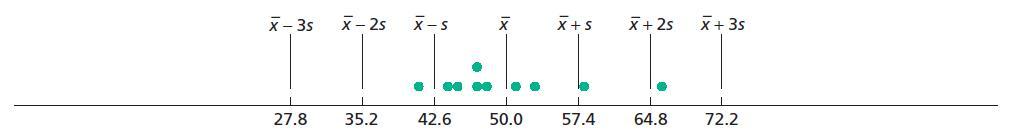
b. Compare the percentage of the observations that actually lie within two standard deviations to either side of the mean with that given by Chebyshev’s rule with k = 2.
c. Repeat part (b) with k = 3.
X-3s 27.8 x-2s X-S X 35.2 42.6 50.0 X+S x + 2s 57.4 64.8 x + 3s 72.2
Step by Step Solution
★★★★★
3.50 Rating (157 Votes )
There are 3 Steps involved in it
1 Expert Approved Answer
Step: 1 Unlock

a The mean of the data set is 830 and the standard deviation is 785 Locate the mean on the horizonta... View full answer
Question Has Been Solved by an Expert!
Get step-by-step solutions from verified subject matter experts
Step: 2 Unlock
Step: 3 Unlock