

Do insurance companies use race as a determining factor when making insurance available? Fienberg (1985) gathered data
Question:
Do insurance companies use race as a determining factor when making insurance available? Fienberg (1985) gathered data from a report issued by the U.S. Commission on Civil Rights about the number of homeowners and residential fire insurance policies issued in Chicago over the months of December 1977 through February 1978. Policies issued were categorized as part of either the standard, voluntary market or the substandard, involuntary market. The involuntary market consists of fair access to insurance requirements (FAIR) plans; these are state insurance programs sometimes subsidized by private companies. These plans provide insurance to people who would otherwise be denied insurance on their property because of high-risk problems. The main purpose is to understand the relationship between insurance activity and the variable race, the percentage minority. Data are available for \(n=47 \mathrm{Zip}\) codes in the Chicago area. These data have also been analyzed by Faraway (2005).
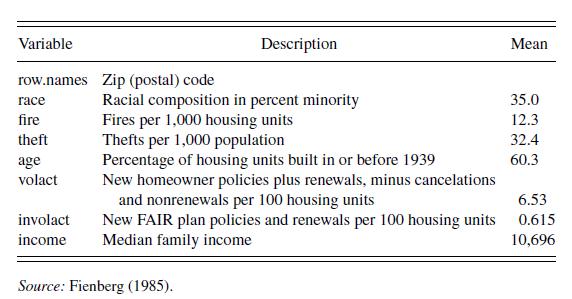
To help control for the size of the expected loss, Fienberg also gathered theft and fire data from Chicago's police and fire departments. Another variable that gives some information about loss size is the age of the house. The median income, from the Census Bureau, gives indirect information on the size of the expected loss and on whether the applicant can afford insurance. Table 6.8 provides more details on these variables.
a. Produce summary statistics of all variables, noting patterns of skewness for each variable.
b. Create a scatterplot matrix of volact, involact, and race. Comment on the three pairwise relationships. Are the patterns consistent with a hypothesis of racial discrimination?
c. To understand relationships among the variables, produce a table of correlations.
d. Fit a linear model using volact as the dependent variable and race, fire theft, age and income as explanatory variables.
d(i). Comment on the sign and statistical significance of the coefficient associated with race.
d(ii). Two Zip codes turn out to have high leverage. Repeat your analysis after deleting these two observations. Has the significance of the race variable changed? What about the other explanatory variables?
e. Repeat the analysis in part (d) using involact as the dependent variable.
f. Define proportion to be involact/(volact + involact). Repeat the analysis in part (d) using proportion as the dependent variable.
g. The same two Zip codes have high leverage in parts (d), (e), and (f). Why?
h. This analysis is done at the Zip-code level, not the individual level. As emphasized by Harrington and Niehaus (1998), this introduces substantial potential omitted variable bias. What variables have been omitted from the analysis that you think might affect homeowners' insurance availability and race?
i. Fienberg notes that proximity of one Zip code to another may affect the dependence of observations. Describe how you might incorporate spatial relations into a regression analysis. relations into a regression analysis.
Step by Step Answer:
a The variable involact is somewhat right skewed but not drastically so The variable involact has several zeros that may be a problem with limited dep...View the full answer


Regression Modeling With Actuarial And Financial Applications
ISBN: 9780521135962
1st Edition
Authors: Edward W. Frees
