

The University of Wisconsin at Madison completed a study titled GenderEquity Study of Faculty Pay,dated June 5,
Question:
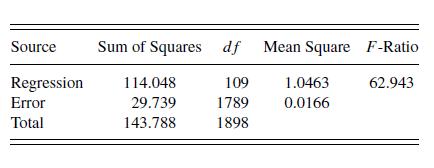
The University of Wisconsin at Madison completed a study titled “GenderEquity Study of Faculty Pay,”dated June 5, 1992. The main purpose of the study was to determine whether women are treated unfairly in salary determinations at a major research university in the United States. To this end, the committee that issued the report studied salaries in the year 1990 of 1,898 faculty members in the university. It is well known that men are paid more than women. In fact, the mean 1990 salary for the 1,528 male faculty members is \($54,478,\) which is 28% higher than the mean 1990 salary for female faculty members, which is \($43,315.\) However, it is argued that male faculty members are, in general, more senior (average years of experience is 18.8) than female faculty members (average years of experience is 11.9) and thus deserved higher pay. When comparing salaries of full professors (thus controlling for years of experience), male faculty members earned about 13% more than their female counterparts. Even so, it is generally agreed that fields in demand must offer higher salaries to maintain a world-class faculty. For example, salaries in engineering are higher than salaries in humanities simply because faculty in engineering have many more employment opportunities outside of academia than faculty in humanities. Thus, when considering salaries, one must also control for department. To control for these variables, a faculty study reports a regression analysis using the logarithm of salary as the dependent variable. The explanatory variables included information on race, sex, rank (assistant professor or instructor, associate professor, or full professor), several measures of years of experience, 98 different categories of departments, and a measure of salary differential by department. There were 109 explanatory variables in all (including 97 departmental binary variables), of which 12 were nondepartmental variables. Table 6.9 reports variable definitions, parameter estimates, and t-ratios for the 12 nondepartmental variables. The ANOVA in Table 6.10 summarizes the regression fit.
Table 6.9
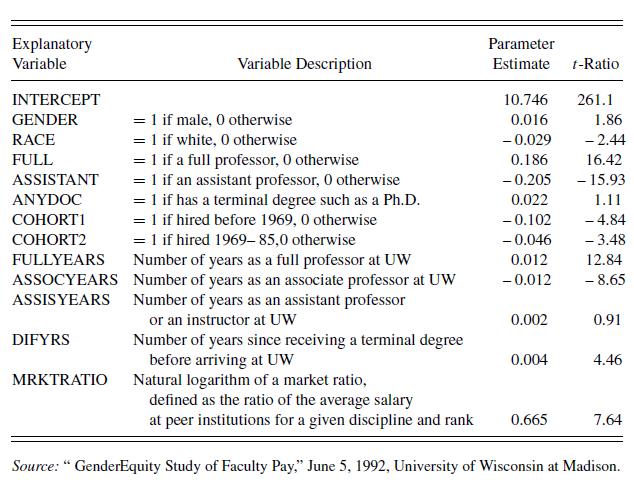
Table 6.10
a. Suppose that a female faculty member in the chemistry department believes that her salary is lower than it should be. Briefly describe how this study can be used as a basis for performance evaluation.
b. From this study, do you think that salaries of women are significantly lower than those of men?
b(i). Cite statistical arguments supporting the fact that men are not paid significantly more than women.
b(ii). Cite statistical arguments supporting the fact that men are paid significantly more than women.
b(iii). Suppose that you decide that women are paid less than men.
From this study, how much would you raise female faculty members salaries to be on par with those of their male counterparts?
Step by Step Answer:


Regression Modeling With Actuarial And Financial Applications
ISBN: 9780521135962
1st Edition
Authors: Edward W. Frees
