

From the Data Bank, choose one of the following variables: educational level, smoking status, or exercise. Select
Question:
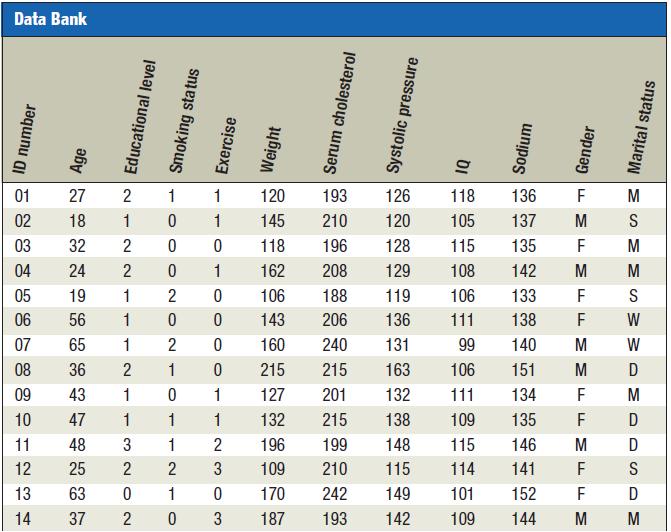
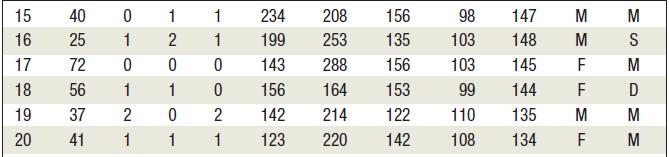
From the Data Bank, choose one of the following variables: educational level, smoking status, or exercise. Select at least 20 values. Construct an ungrouped frequency distribution for the data. For the distribution, draw a Pareto chart and describe briefly the nature of the chart.
Data from Appendix B
Fantastic news! We've Found the answer you've been seeking!
Step by Step Answer:
To construct an ungrouped frequency distribution for one of the given variables well need to select a variable and tabulate the data into a frequency ...View the full answer

Answered By
Grace Igiamoh-Livingwater
I am a qualified statistics lecturer and researcher with an excellent interpersonal writing and communication skills. I have seven years tutoring and lecturing experience in statistics. I am an expert in the use of computer software tools and statistical packages like Microsoft Office Word, Advanced Excel, SQL, Power Point, SPSS, STATA and Epi-Info.
1+ Reviews
10+ Question Solved
Related Book For 

Elementary Statistics A Step By Step Approach
ISBN: 9780077665807
9th Edition
Authors: Allan G. Bluman
Question Posted:
