

Question: In Exercises, a. Obtain and interpret the quartiles. b. Determine and interpret the interquartile range. c. Find and interpret the five-number summary. d. Identify potential
In Exercises,
a. Obtain and interpret the quartiles.
b. Determine and interpret the interquartile range.
c. Find and interpret the five-number summary.
d. Identify potential outliers, if any.
e. Construct and interpret a boxplot.
An issue of Brokerage Report discussed the capital spending of telecommunications companies in the United States and Canada. The capital spending, in thousands of dollars, for each of 27 telecommunications companies is shown in the following table.
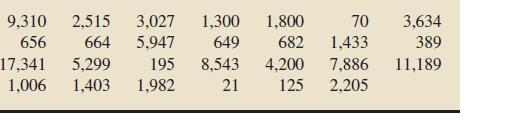
9,310 2,515 3,027 1,300 656 664 5,947 649 195 8,543 1,982 21 17,341 5,299 1,006 1,403 1,800 682 4,200 125 3,634 389 70 1,433 7,886 11,189 2,205
Step by Step Solution
3.36 Rating (159 Votes )
There are 3 Steps involved in it
A Following Procedure 31 Step 1 First arrange the data in increasing order 2170 125 195 389 649 656 664 682 1006 1300 1403 1433 1800 1982 2205 2515 30... View full answer

Get step-by-step solutions from verified subject matter experts