

The frequency distribution shows the total number of points scored in the Super Bowl games from 1967
Question:
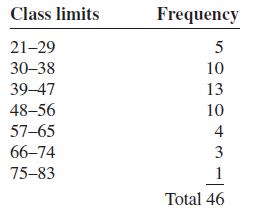
The frequency distribution shows the total number of points scored in the Super Bowl games from 1967 to 2012. Construct a histogram, frequency polygon, and ogive for the distribution. If you were to predict the total number of points for the next Super Bowl game, what range of values would you choose? In how many games were the total points greater than 56?
Fantastic news! We've Found the answer you've been seeking!
Step by Step Answer:
Compute the class boundaries and midpoints X m for the given class limits The general formula for the class boundaries and midpoint are given below Lo...View the full answer

Answered By
Umar Jalal
Hi
This is Umar.
I can help you in the following fields:
1. Accounting
2. Statistics
3. Chemistry
4. Physics
5. Computer Science (Programming)
6. MATH
Linear Algebra
Calculus and Analytical Geometry
Trigonometry
Mathematical Physics
Complex analysis
Vector spaces
Bayes Theorem
Distributions
T distribution
Difference in means
Sampling distribution
Chi-square
Hypothesis Testing
T Paired tests
Confidence intervals
Regression Analysis
All kinds of probability
My services will be in the form of:
· Handwritten file
· Word file
· Step-by-step complete solution
· 100% accurate answer
0 Reviews
10+ Question Solved
Related Book For 

Elementary Statistics A Step By Step Approach
ISBN: 9780077665807
9th Edition
Authors: Allan G. Bluman
Question Posted:
