

Question: Using the normal probability paper shown in Table 63, label the x axis with the class boundaries as shown and plot the percents. Data from
Using the normal probability paper shown in Table 6–3, label the x axis with the class boundaries as shown and plot the percents.
Data from in Table 6-3
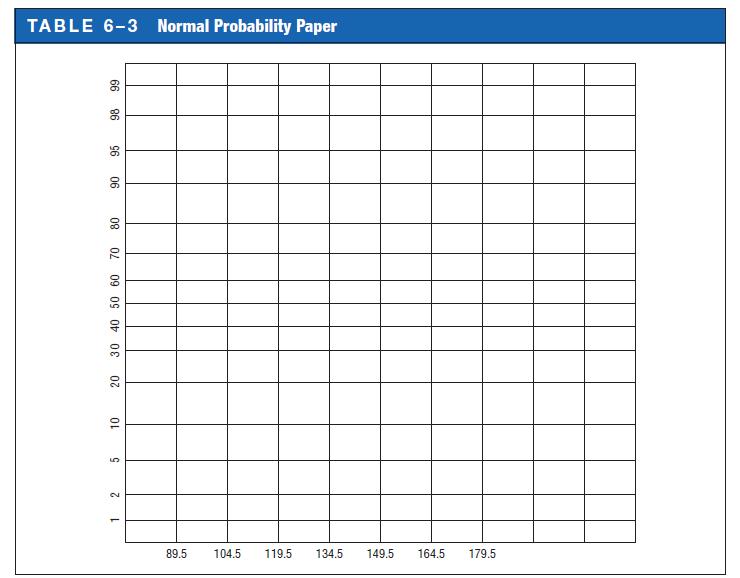
TABLE 6-3 98 99 96 90 80 70 30 40 50 60 Oz 10 5 2 1 Normal Probability Paper 89.5 104.5 119.5 134.5 149.5 164.5 179.5
Step by Step Solution
★★★★★
3.35 Rating (155 Votes )
There are 3 Steps involved in it
1 Expert Approved Answer
Step: 1 Unlock

The frequency distribution of systolic blood pressur... View full answer
Question Has Been Solved by an Expert!
Get step-by-step solutions from verified subject matter experts
Step: 2 Unlock
Step: 3 Unlock