

Question: The normal quantile plot represents service times during the dinnerhours at Dunkin? Donuts (from Data Set 25 ?Fast Food? in Appendix ?B). Data set 25
The normal quantile plot represents service times during the dinnerhours at Dunkin? Donuts (from Data Set 25 ?Fast Food? in Appendix ?B).
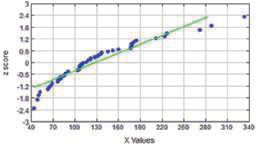
Data set 25
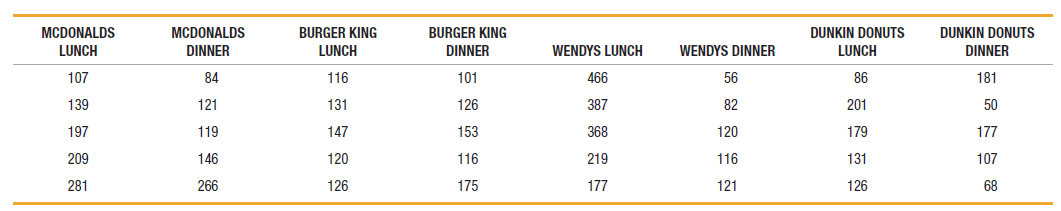
24 18 12 -12 70 100 130 10 130 220 20 200 310 340 X Values 2score MCDONALDS LUNCH MCDONALDS DINNER BURGER KING LUNCH BURGER KING DINNER DUNKIN DONUTS LUNCH DUNKIN DONUTS DINNER WENDYS LUNCH WENDYS DINNER 107 84 116 466 56 86 181 101 139 121 131 126 387 82 201 50 197 119 147 153 368 120 177 179 209 120 116 219 116 131 107 146 266 281 126 175 177 121 126 68
Step by Step Solution
3.33 Rating (153 Votes )
There are 3 Steps involved in it
Not normal the points are no... View full answer

Get step-by-step solutions from verified subject matter experts