

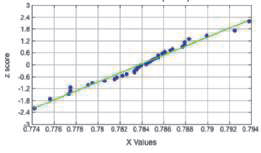
Question: The normal quantile plot represents weights (pounds) of the contents of cans of Diet Pepsi from Data Set 26 ?Cola Weights and Volumes? in Appendix
The normal quantile plot represents weights (pounds) of the contents of cans of Diet Pepsi from Data Set 26 ?Cola Weights and Volumes? in Appendix B.
Data set 26
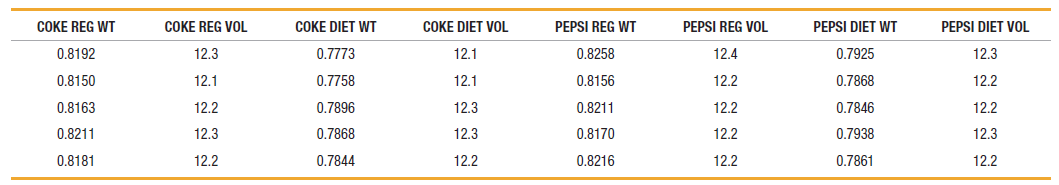
24 12 12 14 a74 0.776 a77 078 0.782 0764 078 0788 0.79 0.72 0.794 X Values COKE REG WT COKE REG VOL COKE DIET WT COKE DIET VOL PEPSI REG WT PEPSI REG VOL PEPSI DIET WT PEPSI DIET VOL 12.3 0.7773 12.1 0.8258 12.4 0.7925 12.3 0.8192 0.8150 12.1 0.7758 12.1 12.2 12.2 0.8156 0.7868 0.8163 12.2 12.3 12.2 12.2 0.7896 0.8211 0.7846 0.7938 12.3 12.3 0.8170 12.2 12.3 0.8211 0.7868 12.2 12.2 12.2 12.2 0.8181 0.7844 0.8216 0.7861
Step by Step Solution
3.30 Rating (171 Votes )
There are 3 Steps involved in it
Normal the points are rea... View full answer

Get step-by-step solutions from verified subject matter experts