

Question: The normal quantile plot represents the distances (miles) that tornadoes traveled (from Data Set 22 ?Tornadoes? in Appendix B). Data set 22 12 24 18
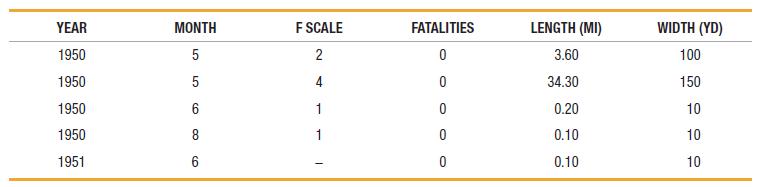
The normal quantile plot represents the distances (miles) that tornadoes traveled (from Data Set 22 ?Tornadoes? in Appendix B).
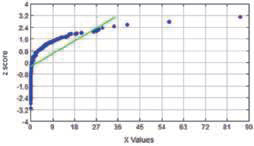
Data set 22
12 24 18 0.0 1.6 24 32 27 36 X Values YEAR MONTH LENGTH (MI) WIDTH (YD) F SCALE FATALITIES 100 1950 1950 1950 5 3.60 5 34.30 150 0.20 10 1950 8 10 0.10 1951 6 10 0.10 co LO
Step by Step Solution
★★★★★
3.53 Rating (167 Votes )
There are 3 Steps involved in it
1 Expert Approved Answer
Step: 1 Unlock

Not normal the points are no... View full answer
Question Has Been Solved by an Expert!
Get step-by-step solutions from verified subject matter experts
Step: 2 Unlock
Step: 3 Unlock