

Question: Display the data below in a Pareto chart. Describe the differences in how the pie chart and the Pareto chart show patterns in the data.
Display the data below in a Pareto chart. Describe the differences in how the pie chart and the Pareto chart show patterns in the data.
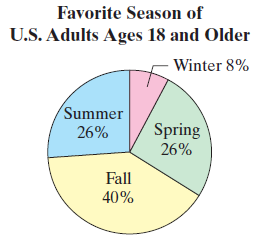
Favorite Season of U.S. Adults Ages 18 and Older Winter 8% Summer Spring 26% 26% Fall 40%
Step by Step Solution
★★★★★
3.45 Rating (168 Votes )
There are 3 Steps involved in it
1 Expert Approved Answer
Step: 1 Unlock

The pie chart helps you to see the percentages as parts ... View full answer
Question Has Been Solved by an Expert!
Get step-by-step solutions from verified subject matter experts
Step: 2 Unlock
Step: 3 Unlock