

Question: Find and graph the logarithmic equation for the data in Exercise 25. The logarithmic equation is a nonlinear regression equation of the form y =
Find and graph the logarithmic equation for the data in Exercise 25.
The logarithmic equation is a nonlinear regression equation of the form y = a + b lnx. Use this information and technology.
Data from Exercise 25:
The shoe sizes and heights (in inches) of 14 men
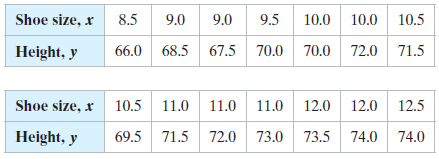
8.5 Shoe size, x 9.5 10.5 10.0 10.0 9.0 9.0 67.5 70.0 70.0 72.0 71.5 66.0 68.5 Height, y Shoe size, x 10.5 Height, y 11.0 11.0 11.0 12.0 12.0 12.5 69.5 71.5 73.5 72.0 71.5 73.0 74.0 74.0
Step by Step Solution
★★★★★
3.49 Rating (172 Votes )
There are 3 Steps involved in it
1 Expert Approved Answer
Step: 1 Unlock

y a blnx 250... View full answer
Question Has Been Solved by an Expert!
Get step-by-step solutions from verified subject matter experts
Step: 2 Unlock
Step: 3 Unlock