

Question: Refer to Data Set 9 in Appendix B and use the paired data consisting of movie budget amounts and the amounts that the movies grossed.
Refer to Data Set 9 in Appendix B and use the paired data consisting of movie budget amounts and the amounts that the movies grossed. Find the best predicted amount that a movie will gross if its budget is $120 million.
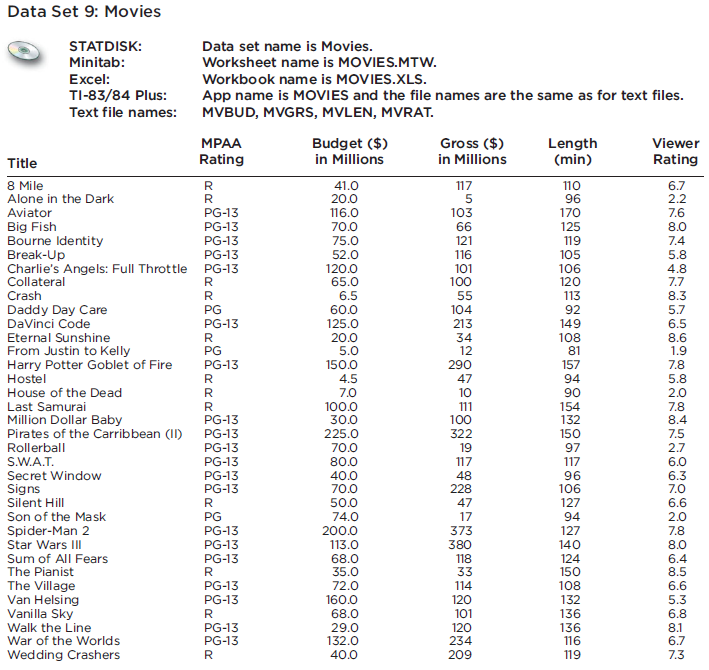
Use the same Appendix B data sets as Exercises 29?32 in Section 10-2. In each case, find the regression equation, letting the first variable be the predictor (x) variable. Find the indicated predicted values following the prediction procedure summarized in Figure 10-5.
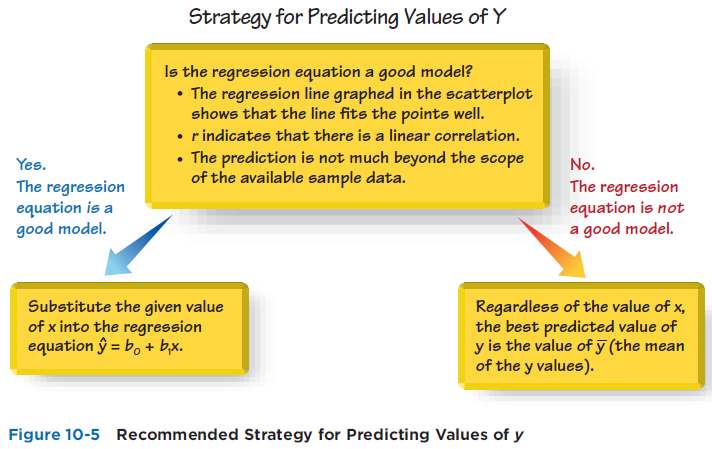
Data Set 9: Movies STATDISK: Minitab: Excel: TI-83/84 Plus: Text file names: Title 8 Mile Alone in the Dark Aviator Crash Daddy Day Care DaVinci Code Eternal Sunshine PG-13 Big Fish PG-13 Bourne Identity PG-13 Break-Up PG-13 Charlie's Angels: Full Throttle PG-13 Collateral From Justin to Kelly Harry Potter Goblet of Fire Hostel House of the Dead Last Samurai Million Dollar Baby Pirates of the Carribbean (II) Rollerball S.W.A.T. Secret Window Signs Silent Hill Son of the Mask Spider-Man 2 Star Wars III Sum of All Fears The Pianist The Village Van Helsing Vanilla Sky Data set name is Movies. Worksheet name is MOVIES.MTW. Workbook name is MOVIES.XLS. App name is MOVIES and the file names are the same as for text files. MVBUD, MVGRS, MVLEN, MVRAT. Walk the Line War of the Worlds Wedding Crashers MPAA Rating R R R R PG PG-13 R PG PG-13 R R R PG-13 PG-13 PG-13 PG-13 PG-13 PG-13 R PG PG-13 PG-13 PG-13 R PG-13 PG-13 R PG-13 PG-13 R Budget ($) in Millions 41.0 20.0 116.0 70.0 75.0 52.0 120.0 65.0 6.5 60.0 125.0 20.0 5.0 150.0 4.5 7.0 100.0 30.0 225.0 70.0 80.0 40.0 70.0 50.0 74.0 200.0 113.0 68.0 35.0 72.0 160.0 68.0 29.0 132.0 40.0 Gross ($) in Millions 117 5 103 66 121 116 101 100 55 104 213 34 12 290 47 10 111 100 322 19 117 48 228 47 17 373 380 118 33 114 120 101 120 234 209 Length (min) 110 96 170 125 119 105 106 120 113 92 149 108 81 157 94 90 154 132 150 97 117 96 106 127 94 127 140 124 150 108 132 136 136 116 119 Viewer Rating 6.7 2.2 7.6 8.0 7.4 5.8 4.8 7.7 8.3 5.7 6.5 8.6 1.9 7.8 5.8 2.0 7.8 8.4 7.5 2.7 6.0 6.3 7.0 6.6 2.0 7.8 8.0 6.4 8.5 6.6 5.3 6.8 8.1 6.7 7.3 Yes. The regression equation is a good model. Strategy for Predicting Values of Y Is the regression equation a good model? The regression line graphed in the scatterplot shows that the line fits the points well. r indicates that there is a linear correlation. The prediction is not much beyond the scope of the available sample data. Substitute the given value of x into the regression equation = b + bx. No. The regression equation is not a good model. Regardless of the value of x, the best predicted value of y is the value of y (the mean of the y values). Figure 10-5 Recommended Strategy for Predicting Values of y
Step by Step Solution
3.38 Rating (164 Votes )
There are 3 Steps involved in it
Thorough calculations and explanations For the Data Set 9 ... View full answer

Get step-by-step solutions from verified subject matter experts