

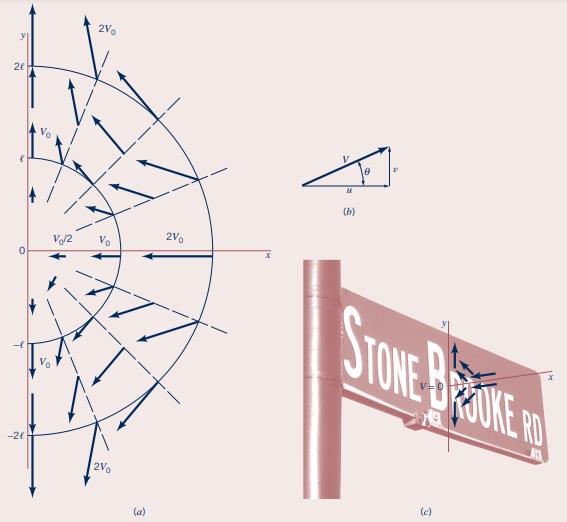
Question: A flow can be visualized by plotting the velocity field as velocity vectors at representative locations in the flow as shown in Fig. E4.1. Consider
A flow can be visualized by plotting the velocity field as velocity vectors at representative locations in the flow as shown in Fig. E4.1. Consider the velocity field given in polar coordinates by \(v_{r}=-10 / r\), and \(v_{\theta}=10 / r\). This flow approximates a fluid swirling into a sink as shown in Fig. P4.6. Plot the velocity field at locations given by \(r=1,2\), and 3 with \(\theta=0,30,60\), and \(90^{\circ}\).
Figure P4.6
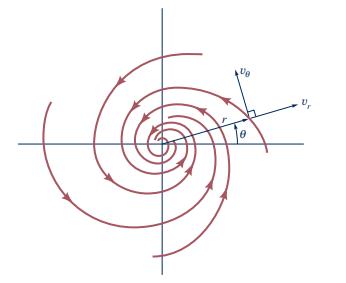
Fig. E4.1
U
Step by Step Solution
★★★★★
3.46 Rating (153 Votes )
There are 3 Steps involved in it
1 Expert Approved Answer
Step: 1 Unlock

Question Has Been Solved by an Expert!
Get step-by-step solutions from verified subject matter experts
Step: 2 Unlock
Step: 3 Unlock