

Question: Plot the five performance curves in Fig. 14.15 for the different impeller diameters in terms of the head and discharge coefficients. Use the impeller diameter
Plot the five performance curves in Fig. 14.15 for the different impeller diameters in terms of the head and discharge coefficients. Use the impeller diameter for D.
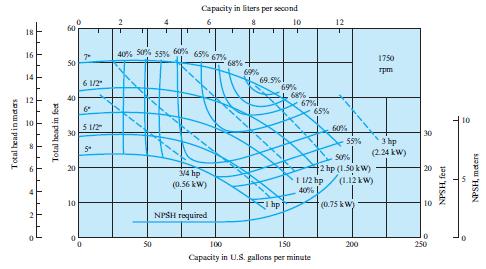
Capacity in liters per second 12 G0% 40% Sos 65% 55% 67% 68% 16 1750 50 pm 69.9% 69% 6 1/2 40 67% 65% 6 10 5 1/2 30 30 3 hp (2.24 kw) 55% 5 2 hp (1.50 kW) 1 1/2 hp /(1.12 kw) 40% 20 20 M4 hp (0.56 kw) 10 hp (0.75 kW NPSH required 50 100 150 200 250 Capacity in U.S. gallons per minute sopu 'HSAN jaaj HSAN Total head in fet Llillll tll Total head in matas
Step by Step Solution
3.40 Rating (159 Votes )
There are 3 Steps involved in it
The graph youve uploaded seems to be a pump performance curve showing total head in me... View full answer

Get step-by-step solutions from verified subject matter experts