

Th e plot shows data taken to measure the rate of water flowing into a tank as
Question:
Th e plot shows data taken to measure the rate of water flowing into a tank as a function of time. Show how to calculate the total amount of water (in kg, accurate to one or two significant figures) that flowed into the tank during the 100 s interval shown.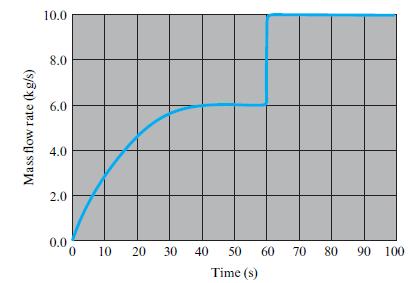
Fantastic news! We've Found the answer you've been seeking!
Step by Step Answer:

Related Book For 

Engineering Fluid Mechanics
ISBN: 9781118880685
11th Edition
Authors: Donald F. Elger, Barbara A. LeBret, Clayton T. Crowe, John A. Robertson
Question Posted:
