

Question: Canadian Manufacturing Workers Workhours. The time plot in Figure 17.9 describes the average annual number of weekly hours spent by Canadian manufacturing workers (data are
Canadian Manufacturing Workers Workhours. The time plot in Figure 17.9 describes the average annual number of weekly hours spent by Canadian manufacturing workers (data are available in CanadianWorkHours.csv—thanks to Ken Black for the data).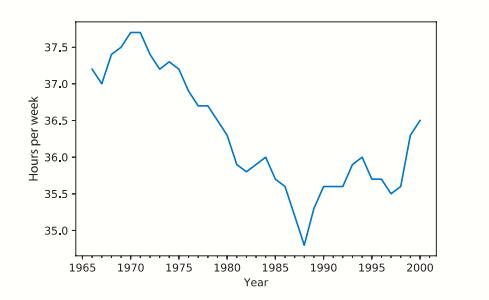
a. Reproduce the time plot.
b. Which of the four components (level, trend, seasonality, noise) seem to be present in this series?
Hours per week 37.5 37.0 36.5 36,0 35.5 35.0 1965 1970 1975 1980 1985 1990 1995 2000 Year
Step by Step Solution
★★★★★
3.49 Rating (152 Votes )
There are 3 Steps involved in it
1 Expert Approved Answer
Step: 1 Unlock

Question Has Been Solved by an Expert!
Get step-by-step solutions from verified subject matter experts
Step: 2 Unlock
Step: 3 Unlock