

Question: Analysis of Canadian Manufacturing Workers Workhours. The time plot in Figure 18 . 22 describes the average annual number of weekly hours spent by Canadian
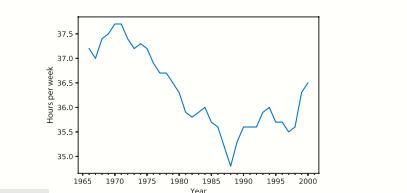
Analysis of Canadian Manufacturing Workers’ Workhours. The time plot in Figure 18 . 22 describes the average annual number of weekly hours spent by Canadian manufacturing workers (CanadianWorkHours.csv, data courtesy of Ken Black).
a. Which of the following regression models would fit the series best? (Choose one.)
• Linear trend model
• Linear trend model with seasonality
• Quadratic trend model
• Quadratic trend model with seasonality
b. If we computed the autocorrelation of this series, would the lag-1 autocorrelation exhibit negative, positive, or no autocorrelation? How can you see this from the plot?
c. Compute the autocorrelation of the series and produce an ACF plot. Verify your answer to the previous question.
Hours per week 37.5 37.0- 36.5 36.0- 35.5 35.0 1965 1970 1975 1980 1985 1990 1995 2000 Year
Step by Step Solution
3.52 Rating (155 Votes )
There are 3 Steps involved in it

Get step-by-step solutions from verified subject matter experts